
American Journal of Information Science and Computer Engineering, Vol. 3, No. 1, January 2017 Publish Date: Jan. 21, 2017 Pages: 1-6
Infrasonic Signals Clustering Based on Hilbert-Huang Transform and K-Means
Xuanchicheng Luo1, Shuqing Ming1, Mei Li1, *, Wei Tang2
1School of Infomation Engineering, China University of Geosciences, Beijing, China
2Comprehensive Nuclear-Test-Ban Treaty Beijing National Data Center, Beijing, China
Abstract
Because of the diversity of infrasound signals, it is difficult to classify different infrasound signals accurately. The different types of infrasound have different characteristics value in energy spectrum, therefore, this study obtained energy spectrum from which can extract the multi-dimensional feature vectors through the Hilbert-Huang transform (HHT)to distinguish different categories of infrasound signals. And then using the K-means algorithm to cluster multi-dimensional feature vectors, which has a good effect on solving the infrasound signal blind classification problem and increases the efficiency of signals clustering.
Keywords
HHT, K-Means, Infrasound Signal, Cluster
Received: November 14, 2016
Accepted: December 21, 2016
Published online: January 21, 2017
@ 2016 The Authors. Published by American Institute of Science. This Open Access article is under the CC BY license. http://creativecommons.org/licenses/by/4.0/
Contents
1. Introduction
Infrasound is a sound of which frequency is less than 20Hz. There exist a wide range of sub sonic waves in nature and human activities. The reason for the generation of the sound wave is various, which can be summed up in two aspects. One is caused by natural phenomenon. The infrasound occurs primarily by fluctuations of the wind, air turbulence, volcano eruption, earthquake, typhoon and waves beating. The second is due to human factors arising from such as nuclear explosions, rocket launchers and supersonic aircraft with flight [1].
Infrasound signals are nonlinear and non-stationary signals. Therefore, the case of using the conventional Fourier transform does not reflect the frequency spectrum changing over time. Wavelet transform’s time-frequency analysis can be performed, but does not have the self-adaptive function and it is also difficult to select thebetter-Wavelet. The Hilbert-Huang transform (HHT) draws wavelet transform’s multiresolution advantages while overcoming the need to select thebetter-Wavelet with good adaptability. Therefore, HHT is selected to extract features of infrasonic signals [2]. Predecessors used a variety of methods for classifying infrasonic signals. Neural networks and Gaussian mixture model are used to classify ship noise and wale sound [3], Zhou Xin had taken a research on signal modulation classification based on SVM and RVM [4]. But the signal classification algorithm needs to be trained by a lot of data. It cannot correctly determine the kinds of signals when the classification algorithm is not trained by a certain type of infrasonic signals, so it has some limitations. By clustering multi-dimensional feature vectors of infrasonic signals through K-means algorithm, we can quickly distinguish between different types of infrasonic signals generally, which thereby solve the problem of blind separation for infrasonic signals and shows good result.
2. Methods
2.1. Hilbert-Huang Transform
The traditional signal analysis and processing are established based on Fourier analysis which is a global transformation that cannot express instantaneous frequency which is precisely the performance and the most fundamental properties of non-stationary signals. Fourier analysis therefore is not suitable for non-stationary signals. The HHT can obtain the instantaneous frequency of the signal and get the ‘time - frequency - energy’ three-dimensional map, which is beneficial for analysis to non-stationary signal such as infrasonic signal. HHT plays a key role in feature extraction of laser micro-Doppler signatures [5], tool wear [6], mine [7] and so on. HHT algorithm is divided into two steps, the first is empirical mode decomposition (EMD), and the second is Hilbert spectrum analysis (HSA).
2.1.1. Empirical Mode Decomposition
The fundamental part of the HHT is theempirical mode decomposition (EMD) method [8]. Breaking down signals into various components, EMD can be compared with other analysis methods such as Fourier transform and Wavelet transform. Using the EMD method, any complicated data set can be decomposed into a finite and often small number of components [9]. These components form a complete and nearly orthogonal basis for the original signal. In addition, they can be described as intrinsic mode functions (IMF).
An IMF is defined as a function that satisfies the following requirements:
1) In the whole data set, the number of extrema and the number of zero-crossings must either be equal or differ at most by one.
2) At any point, the mean value of the envelope defined by the local maxima and the envelope defined by the local minima is zero.
The procedure of extracting an IMF is called sifting. The sifting process is as follows:
1) Identify all the local extrema in the test data![]() .
.
2) Connect all the local maxima by a cubic spline line as the upper envelope![]() .
.
3) Repeat the procedure for the local minima to produce the lower envelope![]() .
.
Their mean is![]() :
:
![]() (1)
(1)
The difference between ![]() and
and ![]() is the first component
is the first component ![]() :
:
![]() (2)
(2)
If ![]() does not satisfy the definition of an IMF, we repeat the above operation k times until
does not satisfy the definition of an IMF, we repeat the above operation k times until ![]() is a first IMF called
is a first IMF called ![]() :
:
![]() (3)
(3)
Stoppage Criteria of the Sifting Process is:
![]() (4)
(4)
Then the sifting process stops when SD is smaller than 0.3.
Once a stoppage criterion is selected, the first IMF, c1, can be obtained. Overall, ![]() should contain the finest scale or the shortest period component of the signal. We can, then, separate
should contain the finest scale or the shortest period component of the signal. We can, then, separate ![]() from the rest of the data by
from the rest of the data by
![]() (5)
(5)
Since the residue ![]() still contains longer period variations in the data, it is treated as the new data and subjected to the same sifting process as described above.
still contains longer period variations in the data, it is treated as the new data and subjected to the same sifting process as described above.
This procedure can be repeated for all the subsequent ![]() 's, and the result is
's, and the result is
![]() (6)
(6)
From the above equations, we can induce that
![]() (7)
(7)
Thus, a decomposition of the data into n-empirical modes is achieved.
2.1.2. Hilbert Spectrum Analysis
Having obtained the intrinsic mode function components, the instantaneous frequency can be computed using the Hilbert Transform [10]. After performing the Hilbert transform on each IMF component, the original data can be expressed as the real part, real, in the following form [11]:
![]() (8)
(8)
Hilbert transform of the IMF:
![]() (9)
(9)
P represents the Cauchy principal value. ![]() is a function composed by
is a function composed by ![]() and
and ![]() :
:
![]() (10)
(10)
Thereby define the amplitude ![]() and the phase
and the phase![]() :
:
![]() (11)
(11)
![]() (12)
(12)
Instantaneous frequency ![]() is:
is:
![]() (13)
(13)
Hilbert spectrum:
![]() (14)
(14)
Hilbert energy spectrum ![]() :
:
![]() (15)
(15)
2.2. K-Means Clustering
K-means clustering is a method of vector quantization, originally from signal processing, that is popular for cluster analysis in data mining. K-means clustering aims to partition n observations into k clusters in which each observation belongs to the cluster with the nearest mean, serving as a prototype of the cluster. This results in a partitioning of the data space into Voronoi cells.
Given an initial set of n samples, the algorithm proceeds by alternating between two steps:
Assignment step: Assign each observation to the cluster whose mean yields the least within-cluster sum of squares (WCSS). Since the sum of squares is the squared Euclidean distance, this is intuitively the "nearest" mean.
![]() (16)
(16)
Update step: Calculate the new means to be the centroids of the observations in the new clusters.
![]() (17)
(17)
The algorithm has converged when the assignments no longer change.
3. Experiments and Result
All data used in this study obtained from Beijing national data center where extracts data from CTBT global infrasound monitoring system. From which we selected 30 infrasonic signals for study. Three types of 30 infrasonic signals are from three distributed monitoring stations globally. See table 1 for more information.
Table 1. Infrasonic signals data.

First, we extracted the active portion from original signal where amplitude fluctuated violently. And then we got the energy spectrum after the active portion was calculated through HHT. The analysis showed that the energy spectrum of different types of infrasonic signals on the first 20 points already has distinct characteristics. So we selected 20 data points of each infrasonic signal’s energy spectrum as feature vectors to input K-means algorithm and then obtaining classification results to see clustering situation. The model of method in Figure 1.
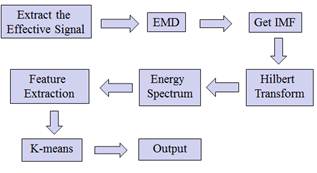
Figure 1. The model of method.
3.1. Feature Vector of Infrasonic Signal
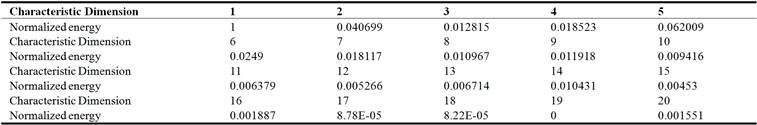
Table 2, Table 3 and Table 4, respectively, is a feature vector for the infrasonic signal calculated by HHT.
Table 2. A feature vector of earthquake.
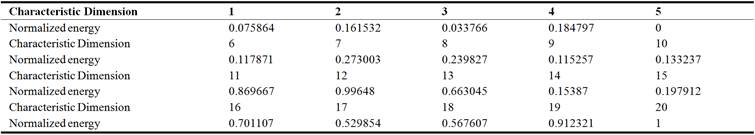
Table 3. A feature vector of seaquake.
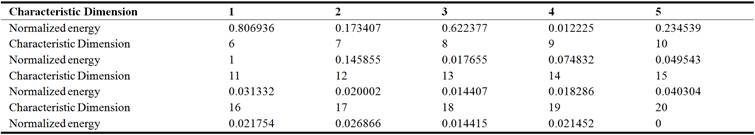
Table 4. A feature vector of volcano.
Hilbert spectrum is viewed as feature vectors. All various feature vectors of infrasonic signals were imaged in figure 2 which could be found that infrasonic signals had very similar feature vectors, and different types of infrasonic signals had clear distinct feature vectors conversely, which helps K-means clustering feature vectors according to its various distances generated.
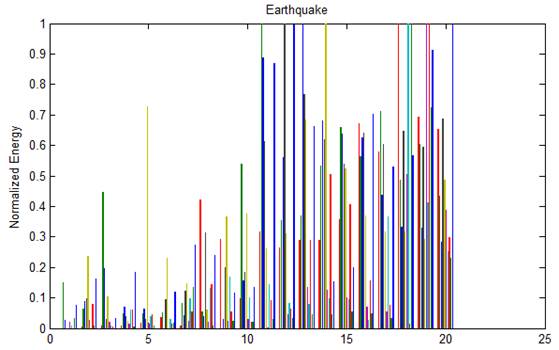
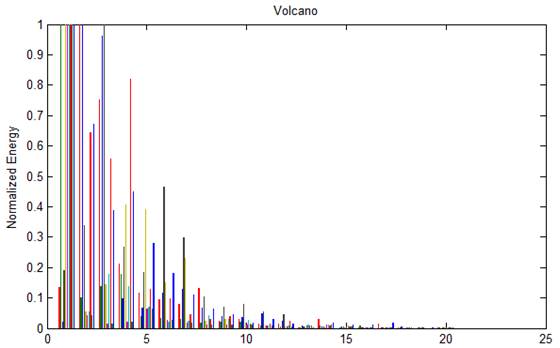
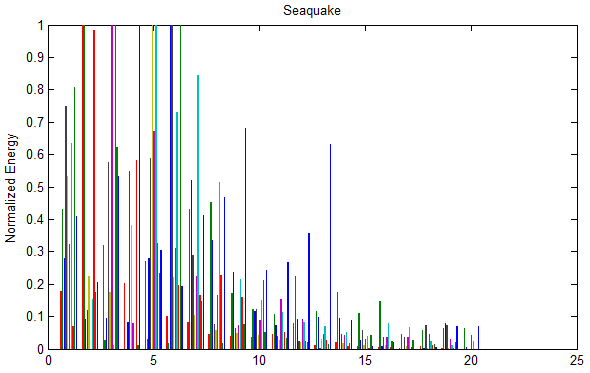
Figure 2. Feature vectors for three types of infrasonic signals.
3.2. The Result of Cluster
To input feature vectors in K-means algorithm, we obtained each cluster centers and cluster. The result as follows:
Table 5. The first cluster center.
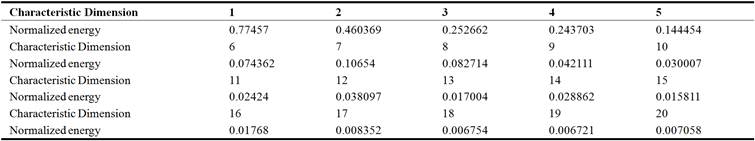
Table 6. The second cluster center.
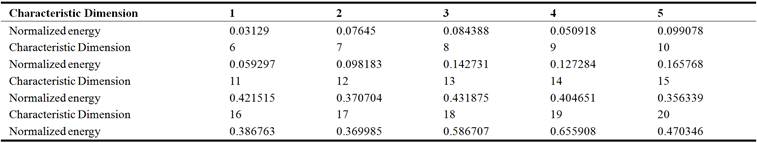
Table 7. The third cluster center.

Table 8. Clustering situation.

4. Discussion
By results of the analysis, we could find that it had good effect on clustering distinct feature vectors. All seismic signals have been cited as one class up to 100%, but the accuracy rate for clustering signals of volcano and seaquake decreased to 80% respectively due to the overlapping portion of the feature vectors.Clustering differs from classification, which does not require large amounts of data pre-training and have higher operational efficiency compared to various classification algorithms. Therefore, in the no label data of a large infrasonic sample, we can quickly distinguish between general data, which is convenient to analyze each signal lately. K-means clustering algorithm needs to be set the number of types of clusters in advance. Therefore, there exist limitations of K-means. The clustering algorithm can be improved to not depend on the number of clusters in the future work. The dimension of signal characteristics can also be further reduced to enhance the efficiency of clustering algorithm.
5. Conclusion
In general, empirical mode decomposition (EMD) and Hilbert spectrum analysis obtain the signal with the actual physical meaning of the instantaneous frequency components and achieve high-resolution time-frequency analysis. Since the decomposition of the spline curve and its median value is performed several times, the density of the time series points is reduced by half for each decomposition, and the amplitude in the time domain is also reduced by half. Therefore, the EMD realizes the multi-scale decomposition on the time domain and Frequency domain. In addition, the similar same infrasonic signals had very similar feature vectors, while the different types of infrasonic signals had clear distinct feature vectors conversely. The k-means algorithm is known for its fast convergence. The satisfactory results prove that the combination of HHT and K-means clustering algorithm meets the requirement of the infrasonic signal clustering.
Acknowledgement
This work was financially supported by The National Natural Science Foundation of China (No. 41572347)
References
- LIU Jun-min, Tang Wei, WANG Xiao-ming, "Analysis of Mechanism to Produce Infrasound Signals and Its Characteristics", Environmental Engineering, 2010, vol. 8, No. 4, pp. 92-96.
- XU Wen-jie, GUAN Hong-yun, WU Xiao-lin, "Analysis of Debris Flow Infrasound Signal Based on Time-frequency Analysis Methods", Computer and Modernization, 2013 (4), pp. 36-39.
- LI Xin-xin, Research on Feature Extraction and Classification of Ship Noise and Whale Sound [D]. Harbin: Harbin Engineering University, 2012, 1-88.
- ZHOU Xin, WU Ying, "Research on Signals Modulation Classification Based on SVM and RVM", Journal on Communications, 2010, vol. 31, No. 8A, pp. 94-99.
- PENG Ming-jin, LI Zhi, "Analysis and Feature Extraction of Laser Micro-Doppler Signatures Based on Hilbert – Huang Transforms", Chinese Journal of Lasers, 2013, vol. 40, No. 8, pp. 0809004.1-6.
- SUN Hui-bin, NIU Wei-long, WANG Jun-yang, "Tool wear feature extraction based on Hilbert-Huang transformation", Journal of Vibration and Shock, 2015, vol. 34, No. 4, pp. 158-164.
- CHI Hui-guang, The application of Hilbert–Huang Transform in Extraction of Mine Characteristics [D], Harbin: Harbin Engineering University, 2007, pp. 1-83.
- N E Huang, M L Wu, S R Long, et al.. A Confidence Limit for the Empirical Mode Decomposition and Hilbert Spectral Analysis [J]. Proceeding of the Royal Society of London, Series A, 2003, 459 (2037), pp. 2317-2345
- Huang N E, Shen Z, Long S R, et al. The empirical mode decomposition and the Hilbert spectrum for nonlinear and nonstationary time series analysis [J ]. Proceedings of the Royal Society of London, Series A, 1998, 454 (1971): 903995.
- SHEN Zhi-yuan, Research on the Theory and Application of Hilbert-Huang Transform [D], Harbin: Harbin Institute of Technology, 2010, pp. 1-54.
- S Kizhner, TP Flatley, NE Huang, et al, On the Hilbert-Huang Transform Data Processing System development, Aerospace Conference, 2004 IEEE, vol 3.


