
American Journal of Information Science and Computer Engineering, Vol. 1, No. 3, September 2015 Publish Date: Sep. 13, 2015 Pages: 130-133
Flow Characteristics Across a Cavity with Variation of Reynolds Using OpenFOAM
Syamsuri*, Dwi Khusna
Department of Mechanical Engineering, Institut Teknologi Adhi Tama Surabaya, Indonesia
Abstract
Developments in science and technology had prompted us to conduct various experiments to create a variety of things, which aims to facilitate and provide benefits for humans and beneficial to the continuation of the next study. Fluid flow across a lid-driven cavity was one of the important phenomena in the fields of engineering, especially fluid mechanics. Some real case such as the air flow in a room was an example of the occurrence of this flow. The method used was numerical simulations using OpenFOAM software to determine the value of the observation of the pressure distribution on the outer and inner wall (2D). Variations of Reynolds numbers used were 40, 100 and 1000. For the kinds of case's lid-driven cavity was used to provide information about the flow phenomena. Further analysis and comparison of the results of the data obtained in order to obtain lid-driven cavity flow phenomena with the potential of increasing the engine work well. From the simulation data obtained that in the case of lid-driven cavity for Reynolds numbers 40 obtained a value of 1.4079 Pa pressure distribution, which causes the formation of eddy (vortex). At Reynold's number of 100 obtained values of 0.738674 Pa pressure distribution which causes the formation of such eddy Reynold's number 40. While at Reynolds numbers 1000 led to declining value of the pressure distribution is equal to 0.226075 Pa. There was an interesting phenomenon, with the increasing of Re the vortex which formed higher and more to the center. Vortex area also greater.
Keywords
Lid Driven Cavity, Reynolds Number, OpenFOAM, Vortex
Received: August 25, 2015
Accepted: September 2, 2015
Published online: September 13, 2015
@ 2015 The Authors. Published by American Institute of Science. This Open Access article is under the CC BY-NC license. http://creativecommons.org/licenses/by-nc/4.0/
Contents
1. Introduction 2. Theory 2.1. Mathematic Model of Flow 2.2. Methodology 3. Result and Discussions 3.1. Grid Independent Test 3.2. Cavity Simulation Results Isobars Contours on Lid-Driven Cavity 3.3. The Simulation Results in the Form of Streamlined on Lid-Driven Cavity for Various Re 3.4. Simulation Results in the Form of Speed Distribution on the Lid-Driven Cavity for Variation of Re 4. Conclusions
1. Introduction
The development of the industrial world today makes tools or methods (both experiments and numerical) are used increasingly growing. Tool or method is used for research on the internal flow have been carried out. Fluid flow which crosses a lid-driven cavity is one important phenomenon in the field of engineering, especially fluid mechanics. Some real case such as air flow in a room is an example of the occurrence of this flow. In recent years the flow of the lid-driven cavity has been examined extensively for different operating conditions. When running on a periodic cavity can be seen as a prototype to study the mixing process.
Various previous studies that have been done on the characteristics of the flow across the lid- driven cavity is a study by [1] showed observations viscoelastic instabilities in the flow recirculation. The research by [2] on the review with regard to the comparison between the results of experimental and computational analysis of fluid mechanic's phenomena of the cavity case. [3] found that two- dimensional flow is characterized by the vortices which explains that the flow field is dominated by a rotating cells fill the cavity. Our work is motivated by the desire to capture the physical aspect of the basic flow and to better understand instability of a pure stream which circulates in the elastic manner.
Furthermore, this research is done numerically of the fluid flow passing through the lid-driven cavity using OpenFOAM software 2.1.1. With the use of software OpenFOAM 2.1.1 can provide information about the flow phenomena that cross lid-driven cavity. Research using OpenFOAM 2.1.1 for the case of fluid flow had been done by [4], [5], and [6] on the fluid-structure interaction. Previous research [7] solved complex flow field problems like the driven cavity flow. The simulation of air flowed in a room by [8]. The present study will get the results on the distribution of pressure on the outer and inner wall. From this information can then be determined flow distribution on the surface contour, the effect of Reynolds number (Re) of the characteristics of the fluid flow and knowing the physical flow of fluid when crossing lid-driven cavity.
2. Theory
2.1. Mathematic Model of Flow
Laminar flow is a fluid that has a certain viscosity, and it is an incompressible flow can be described by the Navier-Stokes equations in an Eulerian reference frame [9],
![]() (1)
(1)
![]() (2)
(2)
where :
![]() is a velocity component
is a velocity component
![]() is a density
is a density
![]() is a gravity component
is a gravity component
![]() is a stress tensor
is a stress tensor
While the equation for stress tensor can be seen in the following equation:
![]() (3)
(3)
where :
![]() is a dynamics viscosity
is a dynamics viscosity
![]() is a pressure
is a pressure
![]() is a cronecker delta
is a cronecker delta
2.2. Methodology
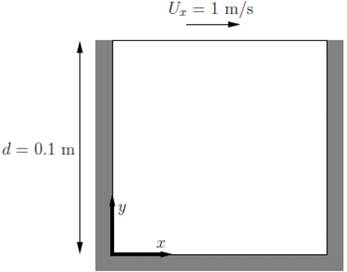
Fig. 1. The geometry of lid-driven cavity.
Initial Condition
U = 1 m/s, p = 0 Pa, d = 0.1 m
Boundary Condition
Inlet (top) for constant velocity U = ( 1, 0, 0 ) m/s
Left, right, and bottom as a wall, No slip at the boundary
Transport properties
The following d = 0,1 m, | U | = 1 m/s, so as to Re = 10, ν = 0,01 m2/s.
3. Result and Discussions
3.1. Grid Independent Test
Before performing simulations on the main case lid-driven cavity first conducted Grid Independent Test to validate the simulation results to the benchmark problems or simulation results of several other studies that already exist. In the benchmark problem which in comparison is the result of a numerical simulation that is streamlined with various grids of meshing for a flow with a Reynolds number of 40. On the grid test was performed 3 grid or levels used in meshing with the increase in the density of the grid are equal to 2 times.
Table 1. The comparison of the minimum speed.
| Grid | 5 x 5 | 10 x 10 | 20 x 20 |
| Present Study | -0.13 | -0.17 | -0.2 |
| Previous Research [10] | -0.2 | -0.2 | -0.2 |
The data were taken from Table 1 to validate the simulation in the case lid-driven cavity is a grid meshing 20x20. This is because the minimum velocity u(y) that was obtained from the grid meshing 20x20, the result is the same as the results that have been done by [10].
3.2. Cavity Simulation Results Isobars Contours on Lid-Driven Cavity
Here is a picture isobars contours of various Reynolds number:
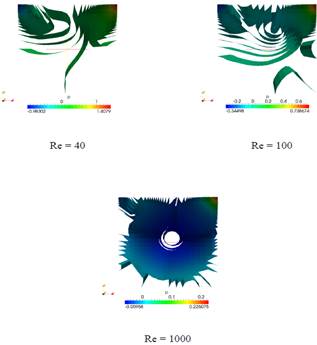
Fig. 2. Pictures of constant pressure lines (isobars) on the lid-driven cavity for various Re.
From the graph display isobars with Re= 40 and Re = 1000 occur constant pressure lines/isobars which are high on the top right and clearly visible red color. However, in each outcome isobar can see the difference. For Re = 40 the value of the pressure is equal to 1.4079 Pa by shifting the line to the left which shows that a decrease in pressure. For Re = 100 the pressure value is equal to 0.738674 Pa by shifting the line to the left indicating that the decrease in pressure to form an eddy (vortex). As for Re = 1000 the value of the pressure is equal to 0.226075 Pa by shifting the line to the left indicating that the decrease in pressure to form an eddy (vortex) which is getting bigger.
3.3. The Simulation Results in the Form of Streamlined on Lid-Driven Cavity for Various Re
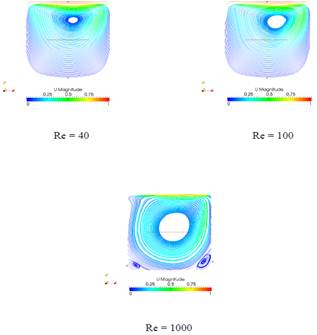
Fig. 3. The graph of streamlined on lid-driven cavity for various Re.
The graph streamlined on lid-driven cavity for various Re is shown in Fig.3. From this figure with Re = 40 and Re = 1000 contained traces of the flow which forms an eddy (vortex). However, in any streamlined results can be seen the difference. For Re = 40 where central eddy (vortex) is located in the middle a little to the right above. Eddy center has the highest speed. According to the law Bernoulli if the speed is high then the pressure will be low. At Re = 100 where central eddy (vortex) located in the middle a little to the right of legally Bernoulli if the speed is high then the pressure will be low. Just like at Re = 40 but the central eddy (vortex) has a larger area. While at Re = 1000 in which the eddy center is located in the center close to the center slightly to the upper right. Here the eddy center area is greater than the other's Re.
3.4. Simulation Results in the Form of Speed Distribution on the Lid-Driven Cavity for Variation of Re
Here is a graph of the velocity distribution for a wide variety of Re numbers:
Fig.4 velocity distribution along the line Y with Re = 40 and Re = 1000. In this section shows the velocity distribution along the Y in the middle position. However in any outcome of the speed distribution graph we can see the difference. At Re = 40 seen that from the position x = 0 to x = 0.05 or in the middle, the speed of the flow tends to go down. While the position of x = 0.05 to x = 0.1 speed tends to increase. At Re = 100 shows that from the position x = 0 to x = 0.045 or in the middle speed tends to fall. Whilst the position of x = 0.045 to x = 0.1 speed tends to increase. At Re = 1000 shows that from the position x = 0 to x = 0.045 or in the middle, speed tends to fall. Whereas the position of x = 0.045 to x = 0.1 speed tends to increase.
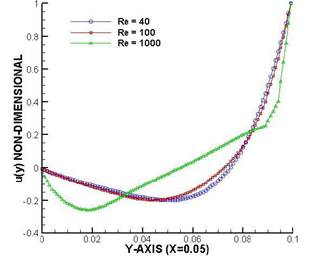
Fig. 4. Velocity distribution graph on the lid-driven cavity for a wide variety of Re numbers.
4. Conclusions
In this study it can be concluded as follows:
1 Results of the validation with the grid 20 × 20 for the minimum speed is -0.2.Whilst the numerical results of previous investigators with the same grid that produces the same value. It is proved that the simulation methods are capable of simulate this case.
2 In case the value of Re 40 there are the characteristics of the flow which forms eddy where the eddy center is located in the middle a little to the upper right.
3 With the value of Re which is the greater then the flow phenomena that occur tend to form a vortex. Vortex center increasingly to the middle and the vortex area greater. Whereas for the value of Re which is smaller than the flow phenomena that occur tend to be the opposite.
References
- A.M. Grillet, E.S.G. Shaqfeh, Observations of viscoelastic instabilities in recirculation flows of Bogen fluids, Journal of Non-Newtonian Fluid Mechanics. 64 (1996) 141-155.
- P.N. Shankar, M.D. Deshpande, Fluid mechanics in the driven cavity, Annu.Rev.Fluid.Mech. 32 (2000) 93-136.
- A.K. Hussein, S.A. Hussain, Mixed convection through a lid-driven air filled square cavity with a hot wavy wall, International Journal of Mechanic and Material Engineering. 5 (2010) 222-235.
- V. Rivola, Comparative study of the CFD codes mistral and openFOAM: application to fluid-structure interaction, Thesis Report. (2007) 1-7.
- T. Ponweiser, P. Stadelmeyer, T. Karasek, Fluid-structure simulations with openFOAM for aircraft designs, Partnership for Advanced Computing in Europe (PRACE) Report, 1-15.
- M. Maylesa, P. Nash, I. Girotto, Performance analysis of fluid-structure interaction using openFOAM, Partnership for Advanced Computing in Europe (PRACE) Report, 1-13.
- V. Ambatipudi, Simple solver for driven cavity flow problem, Project Report. Purdue University. 1 - 8.
- J.S. Silva, B.J.T. Mederos, L.A. Rossi, Simulation of air flow in cold chambers using the openFOAM Computaional Fluid Dynamics(CFD) Software, African Journal of Agricultural Research. 9 (2014) 1-7.
- J.H. Ferziger, M. Peric, Computational methods for fluid dynamics, Springer 3rd Ed., 2002.
- A.C.H. Marques, J.L. Doricio, Numerical investigation of the flow in a two dimensional cavity: meshless, finite volumes and finite differences method, Latin American Journal of Solids and Structure. 3 (2006).


