
American Journal of Information Science and Computer Engineering, Vol. 1, No. 3, September 2015 Publish Date: Aug. 24, 2015 Pages: 126-129
Detecting the Impact of Weekdays on Stock Prices in Egyptian Stock Market Using Data Mining Techniques
Raed S. K. Rasheed*
Faculty of Information Technology, The Islamic University of Gaza, Gaza, Palestine
Abstract
Stock market is one of the most commonly investment environment used for investment in the world. In the last few years the number of individual investors increased rapidly, unfortunately most of them does not use the investment fundamentals. Although, the huge amount of historical data for stock markets, it is not easy to predict the stock behavior using traditional techniques if we considered the unusual factors such as political, economic and psychological impact factors especially in Egypt. In this study we use data mining techniques to detect stocks behavior within the weekdays using Ezz Steel Company as case study; we find a new knowledge of the relation between stocks prices and the weekdays.
Keywords
Data Mining, Stock Data, Rule Induction
Received: July 15, 2015
Accepted: August 1, 2015
Published online: August 24, 2015
@ 2015 The Authors. Published by American Institute of Science. This Open Access article is under the CC BY-NC license. http://creativecommons.org/licenses/by-nc/4.0/
1. Introduction
Stock market is the most commonly investment environment used for investment; it is one of the key indicators of financial performance. In addition, the stock market is an essential part of the economy in developing countries. Apparently, with rapidly increasing of individual investors, it is important to estimate the stock prices and determine the best trading opportunity thoroughly in advance; this brings the high returns, and reduces the potential losses for investors. Egyptian stock market is one of the largest financial markets in the Middle East but faces continuing volatility as a result of political, economic and psychological impact factors. Moreover, this market witnesses a sharp remarkable growth in the past few years. Thus, it is imperative for the Egyptian stock investors on the use of new analytical tools to help them to invest. Although, there is an investing fundamentals and rules should individual investors awareness but the lure of quick profit and immediate trading does not give investors time to learn these fundamentals and rules, and often result of lack of investment experience investors loss a large part of its investment. On the other hand, in the last decade the amount of historical stock data increased rapidly which makes difficult observation of data meaning. Traditional methods such as statistical methods, intuition and expert’s judgment used to predict stock prices and stocks behavior and these methods depend on the stability of stock price. Unusual situation and unstable stock market make us to think for other methods like data mining. Data mining is well founded on the theory that the historic data holds the essential memory for predicting the future direction [1].
Data mining is a set of computer assisted techniques designed to automatically mine large volumes of integrated data for new, hidden or unexpected information, or patterns. Data mining is sometimes known as knowledge discovery in databases KDD [2]. We use as case study data set of Ezz Steel Company one of the most powerful company and one of the most stable stock in the Egyptian stock market.
We discuss in section 3 the data set we use and how we collecting the data, in section 4 we show the data preprocessing and what software we use, in section 5 we use the classification data mining task to show the new knowledge we can get, finally we get the results in section 6.
2. Related Work
Many researchers in the field of forecasting stock prices for a lot of research due to the growing interest in this area, but small number of stock research take care of African stock markets especially Egyptian stock market [10]. Authors of [1] discuss various techniques which are able to predict with future closing stock price will increase or decrease better than level of significance, [3] reports on a preliminary study on stock market data analysis using a hyperspace data mining approach that is built upon a projective geometrical method, [4] propose a three-layer feedforward backpropagation artificial neural network trained with Levenberg – Marquardt algorithm was used to model and predict selected Malaysian stocks, [5] they presents an approach that utilizes artificial neural network techniques to forecast the direction of the Istanbul Stock Exchange (ISE) National-100, [6] they develops a model using a feedforward neural network with two to three layers for forecasting Jordanian stock prices, [7] discuss the modeling of the Indian stock market price index data using artificial neural network. As best we know, no researches for Egyptian stock exchange market have been done even no research shows the relationship between the change rate of the stock and the working days with stock volume especially in the Egyptian stock market.
3. Stock Data
Egyptian stock market is considered as one of the strongest Arab markets and the best emerging markets in the developing world, a market attractive for investment due to the performance of companies listed on the main index of Egyptian Exchange index EGX30 which consist of more powerful thirty companies in the whole Egyptian stock market, and the strength of corporate earnings and profits during the current year 2010. Therefore, we have adopted in this study on a data set of Ezz Steel Company which is one of strongest Egyptian companies listed in the main market index EGX30, and one the most stable stock in the Egyptian stock market, Ezz Steel Company is coded as ESRS.CA. We used the historical data for this company from Club Money Experts. The data is available in http://mec.biz, the beginning date of the data set from June 1999 until September for the current year 2010 and the following table describes the data that we obtained.
After studying the previous fields in table 1 we found that we need to add some technical fields form stock technical analysis that studies the behavior of the stock from domain expert view point to find the impact of these data on the behavior of the stock in the future, the new fields are listed in table 2. Table 3 shows the formulas of the technical fields. Finally we remove ticker, company name, resistances and support fields and collecting remaining fields. The final data set fields used are: Date, Day Name, Open Price, High Price, Low Price, Close Price Volume and Change.
Table 1. Description of received data set fields.
| # | Field | Description |
| 1 | Ticker | The code of the company listed in the stock market index. |
| 2 | Company Name | Company name in the stock market. |
| 3 | Date | Date of the trading day. |
| 4 | Open Price | The opening price early of the trading session. |
| 5 | High Price | The highest price during the trading session. |
| 6 | Low Price | Lowest price during the trading session. |
| 7 | Close Price | Closing price of the end of the trading session. |
| 8 | Volume | The amount of shares traded during the trading session. |
Table 2. Description of additional technical fields.
| # | Field | Description |
| 1 | Day Name | The name of the trading day. |
| 2 | Pivot | The focal point of the arrow. |
| 3 | 1st Resistance | The first point of resistance, which the stock can fall back down. |
| 4 | 1st Support | The first point, which the stock can bounce up. |
| 5 | 2ndResistance | The second point of resistance, which the stock can fall back down. |
| 6 | 2nd Support | The second point, which the stock can bounce up. |
| 7 | Change | The rate of change on the arrow. |
Table 3. Formulas of additional technical fields.
| # | Field | Formula |
| 1 | Day Name | Converted using special date function. |
| 2 | Pivot | (High + Low + Close) / 3 |
| 3 | 1st Resistance | (Pivot * 2) – Low |
| 4 | 1st Support | (Pivot * 2) – High |
| 5 | 2ndResistance | (Pivot – 1st Support) + 1st Resistance |
| 6 | 2nd Support | Pivot – (1st Resistance – 1st Support) |
| 7 | Change | (Close – Open) / (Open / 100)
Where |
4. Data Preprocessing
To do the work of this phase it is necessary to use specialized software; we use an open source toolkit for data mining called RapidMiner. Its strengths reside in part in its ability to easily define analytical steps. we have select RapidMiner version 5.0 which can use for data preparation before processing. After downloading the data from the internet with Microsoft Excel format and adding the technical fields mentioned in the previous section the data imported in RapidMiner seemed to us some notes on the data set:
1. The number of records entered into the software is 2762 records.
2. The presence of missing data in the first record only.
3. The presence of false trading days in the days of Saturday, where Saturday is not a trading day and the number of false records is two.
We delete the record with missing values and delete the records with incorrect values; finally we categorize the change rate field of the stock to the five categories: (Very High, High, Normal, Low and Very Low) according to the formula in table 3.
5. Classification
Data mining classification is a task in the process of data mining. It is used to group items based on certain key characteristics. There are several techniques used for data mining classification, including nearest neighbor classification, decision tree learning, rule induction and support vector machines. Rule induction is one of the most important techniques of machine learning. Since regularities hidden in data are frequently expressed in terms of rules, rule induction is one of the fundamental tools of data mining at the same time [8]. RapidMiner rule induction operator is an operator works similar to the propositional rule learner named Repeated Incremental Pruning to Produce Error Reduction (RIPPER, Cohen 1995). Starting with the less prevalent classes, the algorithm iteratively grows and prunes rules until there are no positive examples left or the error rate is greater than 50%. In the growing phase, for each rule greedily conditions are added to the rule until the rule is perfect (i.e. 100% accurate). The procedure tries every possible value of each attribute and selects the condition with highest information gain. In the prune phase, for each rule any final sequences of the antecedents is pruned with the pruning metric p/(p+n) [9]. We use this operator to find knowledge from extracted rules with parameters:
Criterion = information gain,
Sample ratio = 0.9,
Pureness = 0.9, and
Minimal prune benefit = 0.25.
6. Experimental Results
After running mentioned operator on Ezz Steel Company data set we find the next important rules:
1) If Volume = Normal and Day_Name = Sunday then Change = Low
Meaning: if the volume between 100,000 and 2,000,000 shares and the working day are Sunday then the change rate will be between "-2.0%" and "0.0%".
2) If Volume = Very High and Day_Name = Sunday then Change = Very High
Meaning: if the volume more than 5,000,000 shares and the working day are Sunday then the change rate will be more than "+3.0%".
3) If Volume = Normal and Day_Name = Monday then Change = Low
Meaning: if the volume between 100,000 and 2,000,000 shares and the working day are Monday then the change rate will be between "-2.0%" and "0.0%".
4) If Day_Name = Monday and Volume = High then Change = Very Low
Meaning: if the volume between 2,000,000 and 5,000,000 shares and the working day are Monday then the change rate will be less than "-2.0%".
5) If Volume = Low and Day_Name = Tuesday then
Change = Low
Meaning: if the volume less than 100,000 shares and the working day are Tuesday then the change rate will be more than be between "-2.0%" and "0.0%".
6) If Volume = Normal and Day_Name = Tuesday then Change = Low
Meaning: if the volume between 100,000 and 2,000,000 shares and the working day are Tuesday then the change rate will be between "-2.0%" and "0.0%".
7) If Day_Name = Tuesday and Volume = Very High then Change = Very High
Meaning: if the volume more than 5,000,000 shares and the working day are Tuesday then the change rate will be more than "+3.0%".
8) If Volume = Normal and Day_Name = Wednesday then Change = Low
Meaning: if the volume between 100,000 and 2,000,000 shares and the working day are Wednesday then the change rate will be between "-2.0%" and "0.0%".
9) If Volume = Very High and Day_Name = Wednesday then Change = Very High
Meaning: if the volume more than 5,000,000 shares and the working day are Wednesday then the change rate will be more than "+3.0%".
10) If Volume = Very High and Day_Name = Thursday then Change = Very High
Meaning: if the volume more than 5,000,000 shares and the working day are Thursday then the change rate will be more than "+3.0%".
Table 4. Track Ezz Steel Company stock Dec, 2010.
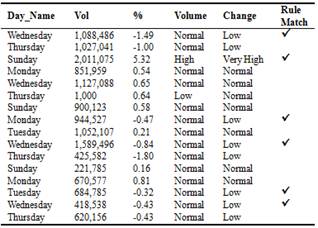
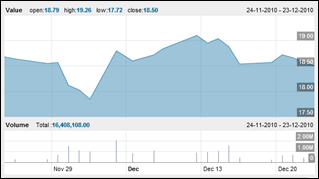
Figure 1. The Ezz Steel Company stock during Dec, 2010.
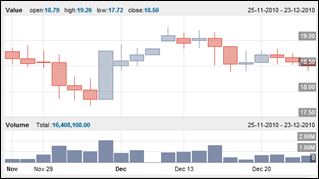
Figure 2. The Ezz Steel Company stock during Dec, 2010 (Candles).
According to the previous rules, and when we track stock prices during Dec, 2010; we found the strong relation between Ezz Steel Company stock change rates and weekdays with stock volume. Figure 1 and Figure 2 depict the stock behavior during Dec, 2010. Table 4 shows the corresponding relation between the extracted rule and the real data; we note that six entries match the rules while others do not. These results can be enhanced by performing more experiments with different parameters.
7. Conclusion
Data Mining is a powerful technique can be used to finding hidden patterns of data. In this study we apply rule induction method as classification task of data mining on Ezz Steel Company data set as case study, and finding a strong relationship between the stock volume with working days and the change rate of the stock, and this will be applicable for other companies in the Egyptian stock listed in EGX30.
References
- K. Kannan, P. Sekar, M. Sathik and P. Arumugam, "Financial Stock Market Forecast using Data Mining Techniques", Proceedings of the International MultiConference of Engineers and Computer Scientists March, 2010, Hong Kong.
- S. Sirikulvadhana, "Data Mining as A Financial Auditing Tool," unpublished thesis (M.Sc) The Swedish School of Economics and Business Administration, 2002.
- N. Chen., Wang W., Zhu D.D., "A study on stock data mining by map recognition", Proceedings of the Second International Conference on Information Fusion. Part vol.2, 1999.
- P. Bahrun and M. Taib, "Selected Malaysia Stock Predictions using Artificial Neural Network" 5th International Colloquium on Signal Processing & Its Applications 2009, Malaysia.
- B. Yildiz, A. Yalama, and M. Coskun, "Forecasting the Istanbul Stock Exchange National 100 Index Using an Artificial Neural Network" presented at PWASET, 2008.
- A. Hammad, S. Ali, and E. Hall, "Forecasting the Jordanian Stock Prices Using Artificial Neural Network," University of Cincinnati, Ohio 2007.
- G. Dutta, P. Jha, A. K. Laha, and N. Mohan, "Artificial Neural Network Models for Forecasting Stock Price Index in Bombay Stock Exchange," Indian Institute of Management Ahmedabad, IIMA Working Papers, 2005.
- Jerzy W. Grzymala-Busse, Witold J.Grzymala-Busse, Rule Induction, The Data Mining and Knowledge Discovery Handbook, ed. By Oded Maimon and LiorRokach, Springer-Verlag, 2005.
- RapidMiner version 5.0 help.
- Shaker, Mohamed Ahmed, and Khairy Elgiziry, Comparisons of asset pricing models in the Egyptian stock market. Accounting and Finance Research 3.4, 2014.


