International Journal of Plant Science and Ecology, Vol. 1, No. 2, April 2015 Publish Date: Mar. 14, 2015 Pages: 26-35
Decomposition Rates and Nutrient Release Patterns of Tephrosia vogelii and Tephrosia candida Residues in Malawi
Munthali M. G.1, *, Gachene C. K. K.1, Karanja N. K.1, Sileshi G. W.2
1University of Nairobi, College of Agriculture and Veterinary Sciences, Department of Land Resource Management and Technology, Nairobi, Kenya
2World Agroforestry Centre (ICRAF), Southern Africa Regional Programme, Lilongwe, Malawi
Abstract
The main input of nutrients in agroforestry systems is achieved through biomass decomposition. A study was carried out to determine the rates of decomposition and N and P release pattern from T. vogelii and T. candida plant residues using litterbag experiments in Malawi. The plant residue treatments included Tephrosia biomass alone or in combination with maize stover. For each treatment, sixteen replicates of litter bags were buried in the soil at the depth of 20cm and Samples were drawn from each litter bag at 1, 2, 3, 4, 5, 6, 7 and 8 week intervals and were analyzed to determine remaining dry matter weight (DMW), N and P. The fastest decomposition rates (k) recorded when T. vogelii or T. candida leaves + twigs + stover were combined, while the slowest was when twigs alone or maize stover alone were used. The Tephrosia residues were high in N (>3.5%) and P (critical value of >2.0%). The N release rates were fastest from twigs of T. vogelii or T. candida followed by maize stover alone, while the slowest release was when T. vogelii leaves were combined with twigs. P release pattern from residues was the same as N release. No N and P immobilization was observed throughout the study period. The results have clearly demonstrated that that the Tephrosia fallow biomass alone decompose considerably faster attaining their half-life within 2–3 weeks and over 95% within 8–25 weeks but when mixed with maize stover (alow quality farm residues) decomposition was slowed down. Therefore, Tephrosia fallow biomass can be used for short-term correction of soil fertility.
Keywords
Tephrosia, Decomposition, Release Pattern, Litterbag, Soil Fertility
Received: February 27, 2015
Accepted: March 9, 2015
Published online: March 12, 2015
@ 2015 The Authors. Published by American Institute of Science. This Open Access article is under the CC BY-NC license. http://creativecommons.org/licenses/by-nc/4.0/
Contents
1. Introduction 2. Materials and Methods 2.1. Study Area 2.2. Experimental Design and Treatments 2.3. Laboratory Analysis 2.4. Statistical Analysis 3. Results and Discussion 3.1. Chemical Composition of Organic Materials Used in the Study 3.2. Decomposition Pattern for Different Plant Materials of T. vogelii and T. candida 3.3. N Release Pattern for Tephrosia 3.4. P Release Pattern for Tephrosia 3.5. Relationship Between Decomposition Rates (kM, kN, kP) and Initial Chemical
Properties of Tephrosia Plant Residues 4. Conclusion and Recommendations Acknowledgements
Properties of Tephrosia Plant Residues 4. Conclusion and Recommendations Acknowledgements
1. Introduction
Over the last century vast regions of arable and pasture lands have been degraded and abandoned in many parts of Africa. On the remaining arable land, loss of soil organic matter (SOM), nutrient limitation and imbalances are also severe. This results mainly from continuous cropping of cereals without rotation with legumes, inappropriate soil conservation practices, and inadequate amounts of fertilizer use (Bationo et al. 2006). Serious nitrogen (N) and potassium (K) deficits also develop because of heavy export in crop harvest. The loss of organic N decreases soil productivity and the agronomic efficiency of fertilizer N, resulting in yield stagnation or decline over time (Mulvaney et al. 2009). While inorganic fertilizers are effective in driving productivity, they have limitations and negative impact on the environment. First, continuous application of large quantities of N fertilizers leads to net loss of soil organic C as mineral N promotes microbial C utilization (Mulvaney et al. 2009). Secondly, the production of fertilizer N is energy-consuming, and N is an environmental pollutant. Some authors have argued that improving the efficiency with which fertilizer N is used is vital to the long-term sustainability of the planet. An equally important goal could be the more effective utilization of biological N-fixation as it account for over 60% of the global production of N (Roy et al. 2003; Zahran, 1999). Given the limitations of inorganic fertilizers and the challenges to make them available at affordable costs in Africa, there is an urgent need for increased use of alternative and complementary inputs in smallholder farming systems in many parts of the developing world. Planting of N-fixing leguminous plant species either as improved fallows or green manures cover crops is receiving considerable attention in the cropping systems of sub-Saharan Africa. The legumes have been reported to increase N fertilizer use efficiency in Malawi (Kamanga et al. 2001).
In Agroforestry systems, the main input of nutrients is achieved through biomass decomposition, by which elements that are essential for plant development and are associated to plant tissues not readily available to crops of commercial interest are released. How fast these residues return to the soil is basically a function of the quality of the organic source, the weather conditions and the presence of decomposing organisms in the system (Myers et al. 1994). In order to develop more efficient systems to improve soil nutrient dynamics, a well-synchronized balance must be established between specific crop demands and supply of nutrients from decomposition of plant residues. Decomposition is a very complex process affected by a wide range of factors which are nutrient availability (soil nutrient content), residue quality (crop residue characteristics), chemical composition, specific soil factors such as texture, mineralogy and acidity, biological activity and the presence of other nutrients (Myers et al. 1994: Sing et al. 2004) and environmental factors such as soil moisture and temperature.
Tephrosia vogelii and T. candida are some of the shrubs that are being used as fertilizer trees in Malawi (Akinnifesi, 2009). The trees are suitable for rehabilitating degraded land, fixing atmospheric N and raise soil P and K levels in proportion to increased levels of organic matter (Huancheng and Jueiming, 1993). No much work has been done to evaluate the potential of T. vogelii and T. candida biomass for soil fertility improvement as well as their decomposition rates in Malawi. Furthermore, knowledge about the proper ways of controlling decomposition rate of Tephrosia biomass applied and thus synchronizing nutrients release with the critical period of high nutrient demand by agricultural crops especially is scanty and has not been well studied in Malawi. Thus, limited studies have been conducted to understand the pattern of Tephrosia decomposition and its release of nutrients in Malawi. Therefore, the objective of this study was to characterize the decomposition rate and N and P release pattern of T. vogelii and T. vogelii residues and optimize their use as sources of organic manure for maize production in Malawi.
2. Materials and Methods
2.1. Study Area
The decomposition study was carried out at Chitedze Agricultural Research Station (located at 13˚ 85′ S and 33˚38′ E) in Malawi. It lies at an altitude of 1146 m above the sea level. The site has one long growing season in a year (October to April). The station receives a mean annual rainfall of 892 mm, 85% falls between November and March. The station is characterized by a mean temperature of 28oC. Climatic data collected during the research period (between January and March 2012) is shown in Figure 1.
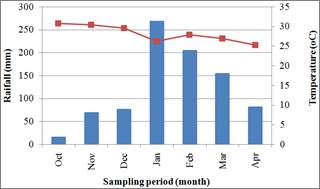
Fig. 1. Mean monthly rainfall and temperature data during the experimental period
2.2. Experimental Design and Treatments
The litterbag experiment was carried out for 8 weeks period between January 2012 and March 2012. The leaves and twigs were collected from the two fallow biomass sites under T. vogelii and T. candida. Maize stovers that were mixed with Tephrosia biomass were collected from the farmers’ field around Chitedze station. Maize stovers were chosen because they are readily available in the fields and are low in polyphenol which is a determinant of the rate of N release. This experiment had 6 treatments. Five for each of the two T. candida and T. vogelii and one treatment of maize stover only with each sample weighing 15g as shown in Table 1.
Table 1. Treatments for the decomposition experiment on T. candida and T. vogelii residues and maize stover
| Treatment | |
| 1 | 15 g Tephrosia leaves |
| 2 | 15 g Tephrosia twigs |
| 3 | 10 g Tephrosia leaves + 5g twigs |
| 4 | 15 g Maize stovers |
| 5 | 10 g Tephrosia leaves+ 5g stovers |
| 6 | 7.5g Tephrosia leaves + 3 g twigs + 4.5g stovers |
Tephrosia leaves, twigs and maize stover were chopped to about 2 cm and placed in 20 cm x 20 cm nylon bag with a 2 mm mesh size to prevent losses of litter to breakage but sufficiently small to allow colonization by microorganisms and invertebrates. For each treatment 16 replicate litter bags were buried in the soil at the depth of 20 cm The litterbags were laid out depending on the treatments and each treatment was buried in one plot and the location of the litterbags in each plot of the blocks were marked using labeling tags. At each sampling period, two litterbags from each treatment were systematically sampled and soil particles and roots growing in the litterbags were manually removed. The litterbags were sampled after 1, 2, 3, 4, 5, 6, 7 and 8 weeks. On each sampling occasion 22 litterbags were examined.
2.3. Laboratory Analysis
The samples were analyzed for initial N, P, K, Ca, Mg, and C. On the other hand, the remaining organic materials were washed with distilled water and oven dried at 75°C for 48 hours to a constant weight for dry weight determination, N and P analysis. The N content of the plant tissues were determined by Kjedahl procedure whereas P content were determined calorimetrically according to Murphy and Rilley (1962) and the K content of the plant tissue were determined by the Flame photometer while Ca and Mg were determined by Atomic Absorption Spectrophotometer (AAS). Organic C was determined using Dichromate-Oxidation Method.
2.4. Statistical Analysis
In all cases, the mass remaining was expressed as percentage of the initial oven dry weight of the residues. Remaining dry matter and nutrients of the residues were fitted to the exponential model of Olson (1963) and the decomposition rate and nutrient loss constants (k) were determined as follows:
![]()
Where:
Wo and Wt are the initial and remaining (at time t) weights of oven-dry organic materials or nutrients pool, respectively
k = decomposition rate constant which was estimated as a slope of the model
t = time (week)
The half-life (time required for 50%, t0.50 to be released) and 95% (t0.95) loss in DMW or element were equal to 0.693/k and 3/k, respectively (Harmon et al., 1999). Non-linear regression procedure of SAS was used to estimate decomposition and N and P release rates. Bias in the estimated values of k (and its 95% confidence limits) were tested using Hougaard's measure of skewness. The values of k were considered reasonably close to linearity if the absolute value of Hougaard's measure is <0.25 but biased if >0.25. Values of k were declared significantly different if their 95% confidence intervals overlap. Correlations between decomposition rates and initial chemical properties of Tephrosia residues were examined using the Pearson correlation coefficient (r)
3. Results and Discussion
3.1. Chemical Composition of Organic Materials Used in the Study
The chemical composition of the plant materials used in the decomposition study is presented in Table 2. The N content of the residues ranged from 1.56 to 5.18% with T. candida leaves and maize stovers alone recording the highest and lowest N content respectively. The quality of plant residues with respect to decomposition can be defined as its relative ease of mineralization by decomposer organisms (Paustian et al., 1997). Quality is largely determined by the organic constituents and nutrient contents. Large differences in the quality of the residues were observed. The N concentrations of all residues apart from maize stover had values > 2.0 to 2.5% below which net N immobilization from the soil would be expected when these residues are applied as soil amendment as indicated by Palm and Sanchez (1991).
Table 2. Chemical characteristics of plant residues used in decomposition study
| Species | Treatment | N (%) | P (%) | K (%) | Mg (ppm) | Ca (ppm) | OC (%) | C/N | C:P |
| T. candida | Leaves | 5.18 | 0.35 | 0.39 | 3.88 | 2.64 | 36.4 | 7.0 | 104.9 |
| Twigs | 2.95 | 0.31 | 0.35 | 3.01 | 2.58 | 35.6 | 12.1 | 116.7 | |
| Leaves +twigs | 3.38 | 0.27 | 0.39 | 2.87 | 2.52 | 28.9 | 8.6 | 107.0 | |
| Leaves + stover | 2.60 | 0.13 | 0.26 | 2.88 | 2.43 | 41.6 | 16.0 | 114.1 | |
| Leaves + twigs + stover | 2.62 | 0.14 | 0.43 | 3.03 | 2.56 | 41.2 | 15.7 | 302.9 | |
| T. vogelii | Leaves | 5.02 | 0.21 | 0.43 | 3.96 | 2.78 | 32.1 | 6.4 | 150.0 |
| Twigs | 2.75 | 0.21 | 0.60 | 2.92 | 2.54 | 31.7 | 11.5 | 152.4 | |
| Leaves + twigs | 3.35 | 0.18 | 0.52 | 3.44 | 2.58 | 37.6 | 11.2 | 212.4 | |
| Leaves + stover | 2.32 | 0.13 | 0.26 | 2.85 | 2.63 | 40.0 | 17.2 | 317.5 | |
| Leaves + twigs + stover | 2.11 | 0.13 | 0.39 | 3.27 | 2.22 | 37.2 | 17.6 | 297.6 | |
| Maize stover alone | 1.56 | 0.07 | 0.43 | 2.93 | 2.45 | 41.6 | 26.7 | 602.9 |
3.2. Decomposition Pattern for Different Plant Materials of T. vogelii and T. candida
The decompositions patterns for the different residues are shown in Fig. 2. The decomposition rate constants (k) and the days taken for 50% (t50) and 95% (t95) decomposition for the different residues are presented in Table 3. The decomposition rate constants (k) for all the plant residues were unbiased, and these ranged from 0.15 wk-1 for maize stover alone to 0.34 wk-1 with mixture of T. candida leaves + twigs + stover. (Table 3). The rate for maize stover alone was significantly slower than most treatments except twigs alone (Fig. 2; see also 95% CI in Table 3). The mass loss in all the plant residues for both species was faster between the first and fourth week. Between the second and fourth week of decomposition, the residues had lost almost 50% of their initial mass (Fig. 2). The model used explained 90-99% of the variation (r2 = 0.90-0.99)
The decomposition of residues of the two species followed the same pattern and order; the highest being in the mixture of leaves + twigs + stover and lowest in maize stover alone. The decomposition pattern was biphasic with an initial rapid phase followed by a slower phase. A similar pattern was observed by Tetteh (2004), Constantinides and Fownes (1994), McDonagh et al. (1995) and Nhamo et al. (2007). The rapid mass loss during the early stages of the organic materials was due to release of water soluble components such as sugars, amino acids and soluble phenolics (Wang et al. 2004; Bross et al. 1995). Young plant materials are more rapidly decomposed than the old materials that contain generally a large amount of stable polysaccharides such as cellulose, hemicelluloses and lignin (Zech et al. 1997). The slow loss of biomass recorded during the late stages of decomposition reflected the decline in quality of the biomass and could be due to the presence or decomposition of recalcitrant materials such as lignin, hemicelluloses and soil microbial products (Saviozzi et al. 1997). Nyamai (1994) also observed that the decomposition of the foliage of five agroforestry tree species started rapidly and continued for some weeks and then gradually became slow. The rapid decomposition of the plant residues in this study could be due to high levels of nutrients, notably N, which are reported to accelerate the decomposition process (Alhamd et al. 2004). The rapid rate of decomposition of these plant residues has implications for nutrient availability to associated crops. Rapid rate of decomposition meant less organic matter addition to the soil.
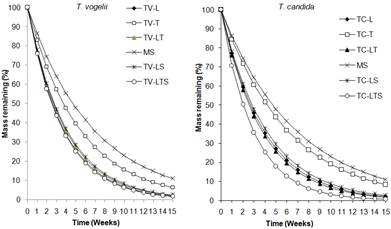
Fig. 2. Biomass loss by organic materials from T. vogelii
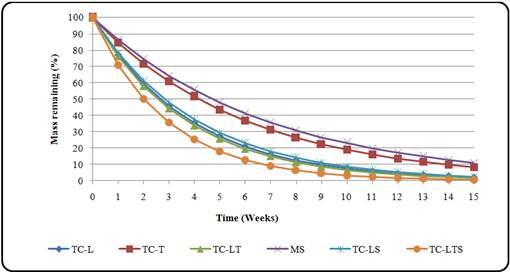
Fig. 3. Biomass loss by organic materials from T. candida
Key
TV = T. vogelii, TC = T. candida, L = Leaves, T = Twigs, LT = Leaves + twigs
MS = Maize stover, LS = Leaves + stover, LTS = Leaves+ twigs + stovers
Table 3. Decomposition rate constant (k), coefficient of determination (r2), correlation coefficient (r) and half life (t50) and t0.95 of the residues of Tephrosia
| Species | Treatment | Model | k wk-1 | r2 | t50 | t95 |
| T. vogelii | Leaves | y =14.14e-0.27t | 0.27 | 0.97 | 2.57 | 11.11 |
| Twigs | y =15.32e-0.19t | 0.19 | 0.98 | 3.75 | 16.22 | |
| Leaves +twigs | y =14.19e-0.26t | 0.26 | 0.97 | 2.69 | 11.63 | |
| Leaves + stover | y =13.58e-0.25t | 0.25 | 0.91 | 2.77 | 12.00 | |
| Leaves + twigs + stover | y =14.56e-0.28t | 0.28 | 0.91 | 2.51 | 10.87 | |
| T. candida | Leaves | y =14.20e-0.26t | 0.26 | 0.97 | 2.67 | 11.54 |
| Twigs | y =15.43e-0.17t | 0.17 | 0.98 | 4.17 | 18.07 | |
| Leaves +twigs | y =13.48e-0.27t | 0.27 | 0.90 | 2.55 | 11.03 | |
| Leaves + stover | y =14.27e-0.25t | 0.25 | 0.96 | 2.83 | 12.24 | |
| Leaves + twigs + stover | y =14.51e-0.34t | 0.34 | 0.97 | 2.01 | 8.72 | |
| Maize stover alone | y =15.10e-0.15t | 0.15 | 0.98 | 4.71 | 20.41 |
Note: The significance of fit for all the treatments was P<0.0001.
Fig. 4. N release pattern from T. vogelii plant residues
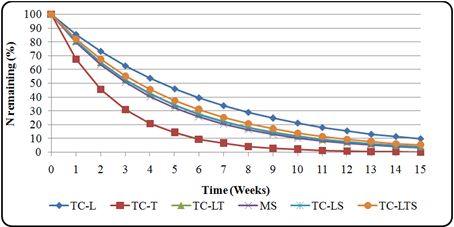
Fig. 5. N release pattern from T. candida plant residues
Key
TV = T. vogelii, TC = T. candida, L = Leaves, T = Twigs, LT = Leaves + twigs
MS = Maize stover, LS = Leaves + stover, LTS = Leaves+ twigs + stovers
Table 4. N release pattern for T. vogelii and T. candida plant residues
| Species | Treatment | Model | k wk-1 | r2 | t50 | t95 |
| T. vogelii | Leaves | y =5.17e-0.17t | 0.17 | 0.94 | 4.01 | 17.34 |
| Twigs | y =2.74e-0.30t | 0.30 | 0.98 | 2.28 | 9.87 | |
| Leaves +twigs | y =3.54e-0.12t | 0.12 | 0.94 | 5.78 | 25.00 | |
| Leaves + stover | y =2.34e-0.13t | 0.13 | 0.97 | 5.41 | 23.44 | |
| Leaves + twigs + stover | y =2.25e-0.18t | 0.18 | 0.95 | 3.92 | 16.95 | |
| T. candida | Leaves | y =4.95e-0.16t | 0.16 | 0.90 | 4.47 | 19.35 |
| Twigs | y =2.69e-0.39t | 0.39 | 0.92 | 1.78 | 7.69 | |
| Leaves +twigs | y =3.64e-0.21t | 0.21 | 0.94 | 3.25 | 14.08 | |
| Leaves + stover | y =2.87e-0.22t | 0.22 | 0.91 | 3.22 | 13.95 | |
| Leaves + twigs + stover | y =2.90e-0.20 | 0.20 | 0.91 | 3.54 | 15.31 | |
| Maize stover alone | y =1.48e-0.23t | 0.23 | 0.97 | 3.07 | 13.27 |
3.3. N Release Pattern for Tephrosia
Fig. 4 and Fig. 5 show the N release pattern of different plant residues for T. vogelii and T. candida respectively. The percent N release for plant residues for both species was highest in twigs (Fig. 4 and 5) and kN ranged from 0.12 to 0.39 wk-1. In all cases, there was an initial rapid release of N and slower release from the sixth week onwards from all the plant residues but Plant residues for T. candida had the highest N release rates than T. vogelii (Table 4). Percent N release rate for both species was in decreasing order TC twigs>TV twigs>maize stover>TC leaves and stovers>TC leaves + twigs>TC Leaves + twigs + stover>TV Leaves + twigs + stover>TV leaves>TC leaves>TV leaves + stover>TV leaves + twigs (Table 4.5). At two weeks, twigs had almost released 50% N while the rest of the residue treatments released almost 50% of N between third and fourth week. The highest N release by twigs indicates fast mineralization while lowest means slow N release. There was no period of N immobilization during the whole period of the experiment.
The % N remaining in each sampling date did not exceed 100% for all residues from both species and N immobilization was not evident throughout the incubation period. Generally, there was rapid decrease in N content for all the treatments especially in the first week which indicates removal of water-soluble organic substances (Wang et al. 2004; Bross et al. 1995). N release from the crop residues followed a different pattern from that of the mass loss. All treatments showed rapid rate of mineralization throughout the study period. Similar pattern of N dynamics have been reported by other researchers (Schomberg et al. 1994). The twigs for both species released N rapidly than maize stover especially during the first two weeks. This could be attributed to their high N content and low C: N ratios compared to low N content and high C: N ratio in maize stover. Mixing maize stover with Tephrosia biomass or mixture of soft twigs and leaves slowed the rate of decomposition. The findings are in accordance with Bunyasi (1997), Handayanto et al. (1997) and Kuo and Sinju (1998) who reported that mixing high with low quality organic materials contributed to better N use through slowing the fast release of nutrients by former and reducing immobilization by the latter materials.
Organic residues with high C to N ratios tend to mineralize much slowly than materials with lower ratios under the same conditions. High quality organic materials decompose very fast releasing N initially in excess of plant demand (Handayanto et al. 1994). Much of the N from organic inputs not used by the crop is usually incorporated into various SOM pools or assimilated by the associated trees and remains in the systems (Vanlauwe et al. 1999). On the other hand, N from inorganic pools not taken by the crop is subjected to higher levels of leaching and denitrification. The accumulation of N in SOM pools over time is more sustainable compared to inorganic N fertilizer which releases nutrients rapidly. Synchrony between N release from high organic materials with the crop’s N demand can be achieved by optimizing timing of the application of organic materials, and by combining high and low quality organic materials (Rutunga et al. 2001; Gitari 2000a; Handayanto et al. 1997). The lack of net N immobilization in some species such as T. diversifolia was also reported (Rutunga et al. 2001) in the tropics which is consistent with the observation made here. Improved synchronization between N net mineralization (N release) from organic materials and plant N demand has been advocated as a means of improving N use efficiency (Myers et al. 1994), especially in tropical cropping systems.
3.4. P Release Pattern for Tephrosia
Release of P from the T. vogelii and T. candida residues was very rapid and regular for all the residues during the first week (Fig. 6 and Fig. 7). All the plant residues released almost 50% of their initial P content by fourth week (Table 5). As observed for N, P release rates (kp week-1) were highest in T. candida twigs (kP = 0.44 wk-1) and lowest in maize stover and TV Leaves + twigs + stove (kP = 0.16 wk-1)throughout the incubation period (Table 5). Percent P release rate for both species was in the order TC twigs>TC leaves + twigs>TC leaves>TC leaves and stovers>TC Leaves + twigs + stover>TV twigs>TV leaves + stover>TV leaves>TV leaves + twigs=maize stover=TV Leaves + twigs + stover. No P immobilization for T. vogelii residues were observed throughout the experiment.
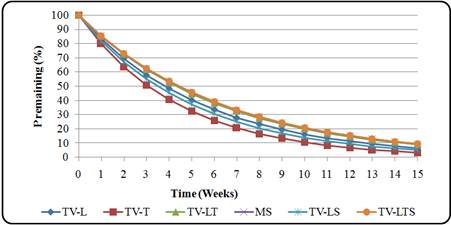
Fig. 6. P release pattern from T. vogelii plant residues
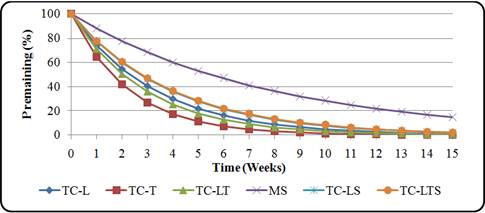
Fig. 7. P release pattern from T. candida plant residues
Key
TV = T. vogelii, TC = T. candida, L = Leaves, T = Twigs, LT = Leaves + twigs
MS = Maize stover, LS = Leaves + stover, LTS = Leaves+ twigs + stovers
Table 5. Parameters of the P release pattern for T. vogelii and T. candida plant residues
| Species | Treatment | Model | k wk-1 | r2 | t50 | t95 |
| T. vogelii | Leaves | y =0.20e-0.18t | 0.18 | 0.97 | 3.81 | 16.48 |
| Twigs | y =0.21e-0.23t | 0.23 | 0.96 | 3.08 | 13.33 | |
| Leaves +twigs | y =0.19e-0.16t | 0.16 | 0.94 | 4.30 | 18.63 | |
| Leaves + stover | y =0.13e-0.20t | 0.20 | 0.98 | 3.50 | 15.15 | |
| Leaves + twigs + stover | y =0.13e-0.16t | 0.16 | 0.96 | 4.41 | 19.11 | |
| T. candida | Leaves | y =0.34e-0.34t | 0.34 | 0.95 | 2.04 | 8.82 |
| Twigs | y =0.28e-0.48t | 0.44 | 0.91 | 1.59 | 6.86 | |
| Leaves +twigs | y =0.27e-0.34t | 0.34 | 0.99 | 2.02 | 8.75 | |
| Leaves + stover | y =0.13e-0.26t | 0.26 | 0.99 | 2.70 | 11.67 | |
| Leaves + twigs + stover | y =0.14e-0.25t | 0.25 | 0.99 | 2.74 | 11.86 | |
| Maize stover alone | y =0.07e-0.16t | 0.16 | 0.94 | 4.41 | 19.11 |
Note: The significance of fit for all the treatments was p<0.0001 except for TC-T which had P<0.0001
Table 6. Pearson correlation coefficient (r) between decomposition rates (kM), nutrient release rate (kN and (kP)) and initial chemical properties of the organic materials
| T. vogelii | T. candida | |||||
| Decomposition rate Nutrient | kM | kN | kP | kM | kN | kP |
| N | 0.52* | -0.21 | 0.16 | 0.35 | -0.32 | 0.58* |
| P | 0.39 | 0.13 | 0.55* | 0.06 | 0.18 | 0.89** |
| C | -0.35 | 0.62* | 0.25 | 0.12 | -0.24 | -0.28 |
| K | 0.11 | -0.18 | 0.42 | 0.28 | 0.02 | 0.65* |
| Ca | 0.61* | -0.34 | -0.30 | 0.16 | -0.40 | 0.25 |
| Mg | -0.24 | -0.42 | -0.57* | -0.07 | -0.14 | -0.66* |
| C:N | -0.59* | 0.11 | -0.40 | -0.45 | 0.06 | -0.81** |
| C:P | -0.60* | 0.03 | -0.51 | -0.35 | -0.11 | -0.80** |
Note: kM = mass loss decomposition rate kN = N release rate kP = P release rate
* Correlation significant at P <0.05
** Correlation is significant at P<0.001
The rapid loss of P observed in this study after the first week was probably due to removal of soluble P after burying the litterbags. Many studies indicated that P can be leached in the early stages of decomposition (Musvoto et al. 2000). However, the increase of P leaching reported here at the last stages of decomposition period which synchronized with the onset of the rainy season had also been observed in other studies (Blair, 1988; Tripathi and Singh, 1992).
3.5. Relationship Between Decomposition Rates (kM, kN, kP) and Initial Chemical Properties of Tephrosia Plant Residues
Correlations between decomposition rates and initial chemical properties of Tephrosia residues were examined using the Pearson correlation coefficient (r) Significant and positive correlations were found between kP day-1 and P (p < 0.001, r = 0.89).N p < 0.05, (r = 0.58), K (p < 0.05, r = 0.65), C:N ratio (p < 0.001, r = -0.81) and C: P ratio (p < 0.05, r =0.58) (Table 6).
The results from Table 6 have indicated that initial chemical characteristics (N, Ca, C: N and C: P ratios) of the plant residues did significantly affect the decomposition rate (kM) for T. vogelii residues while kM for T. candida was not affected by a single parameter. kN for T. vogelii was affected by initial organic carbon alone while T. candida was affected by none. In terms of kP, T. vogelii residues were affected by P, Mg and C: N ratio while T. candida residues were affected by all the initial chemical characteristics except C and Ca. Thus, in this study, either N concentration or C to N ratio was useful in predicting decomposition rate (kM) and P release (kP) of T. vogelii and T. candida. Meaning, in this study, neither N concentration nor C/N ratio was useful in predicting decomposition rates (kM) of T. candida and N and P release rates (kN and kP) of T. vogelii. The assertion that initial N concentration and C: N ratio influences the degradability of organic residues added to the soil was not confirmed by the results of this experiment. Results may be related to different decomposer communities which may have developed on plant materials based on their intrinsic qualities (Cobo et al. 2002). Among the plant chemical characteristics studied, only N, P, C: N and C: P ratio served as useful indicators of degradability of plant materials based on significant results (Table 4.7). The nutrient release patterns followed by the tree species studied demonstrate the importance of substrate quality in nutrient dynamics. The findings corroborate with findings of Kwabiah et al. (2001), who studied the relationship between quality and the per cent of leaf mass, N and P remaining. They found out that, total P and C: P ratio showed more consistent relationships with the per cent of leaf mass, N, and P remaining compared to other quality parameters such as N: P and L + PP: P ratios.
4. Conclusion and Recommendations
From the decomposition study, it can be concluded that the Tephrosia fallow biomass alone decompose considerably fast attaining their half-life within 2 – 3 weeks and over 95% within 8 – 25 weeks but when mixed with maize stover, a low quality farm residues, the decomposition rates slowed down. Based on these results the fresh leaves or twigs or mixture of leaves and twigs of T. candida and T. vogelii can be considered of high quality litter and may be applied as green manure to short duration crops such as vegetables as well as most annual crops. Meanwhile, the accelerated decomposition and nutrient release of Tephrosia fallow biomass may limit its potential for long term build-up of soil fertility. Tephrosia fallow biomass can be used for short-term correction of soil fertility while maize stover alone can be used for long-term build-up of soil organic matter. Alternatively, organic residues such as Tephrosia can be mixed with maize stover in order to slow down the decomposition and nutrient release rates so that it can be considered for long-term build up of soil fertility. Results from this study have added to knowledge on how to tailor the application of Tephrosia biomass in cropping systems and Agroforestry for improved nutrient synchronization. This study has also added to knowledge on the quality, decomposition and nutrient release patterns of Tephrosia residues in farming systems in Malawi. An understanding of how plant residues decompose and release nutrients would help to provide an insight into how to complement this with the use of aboveground litter to synchronize with crop demand in Agroforestry systems in Malawi.
Acknowledgements
The Authors wish to gratefully acknowledge the assistance of Alliance for Green Revolution (AGRA) and World Agroforestry Centre (ICRAF-Malawi) for funding this study. Thanks also to the Department of Forestry for financial assistance and finally to the director and staff- Chitedze Research station for the assistance in analysis.
References
- Akinnifesi F. K., Ajayi O. C., Sileshi G., Chirwa P. W. and J. Chianu (2009). Fertilizer trees for sustainable food security in the maize-based production systems of East and Southern Africa. A review, Agronomy for Sustainable Development, vol. 30, pp. 615-629, 2010.
- Alhamd, L., Arakaki, S. and Hagihara, A. (2004). Decomposition of leaf litter of four tree species in a subtropical evergreen broad-leaved forest, Okinawa Island, Japan. Forest Ecology and Management 202(1 – 3): 1 − 11.
- Blair, J.M. (1988) Nutrient release from decomposing foliar litter of three species with special reference to calcium, magnesium and potassium dynamics. Plant Soil 110: 49-55.
- Bross, E.L., Gold, M.A. & Nguyen, P.V. (1995). Quality and decomposition of black locust (Robinia pseudoacacia) and alfalfa (Medicago sativa) mulch for temperate alley cropping systems. Agroforestry Systems, 29, 255-264.
- Bunyasi, W.S. (1997). Effects of Chemical Composition of Plant Residues on Nitrogen Release and Crop Uptake. M.Sc. thesis. University of Nairobi; Kenya.
- Cobo JG, Barrios E, Kass DCL, Thomas R (2002). Nitrogen mineralization and crop uptake from surface-applied leaves of green manure species on a tropical volcanic-ash soil. Biol Fert Soils 36: 87-92.
- Constantinides, M. & Fownes, J .H. (1994). Nitrogen mineralization from leaves and litter of tropical plants: Relationship to nitrogen, lignin and soluble polyphenol concentrations. Soil Biology and Biochemistry, 26, 49-55.
- Gitari, J.N., E.A. Dyck and P. Maina (2000a) Legume screening for soil fertility improvement, food and fodder utilization in medium altitude areas of mount Kenya region. In: Mureithi J.G., C.W. Mwendia, F.N. Muyekho, M.A. Anyango and S.N. Maobe (Eds) Participatory technology development for soil management by smallholders in Kenya. Special publication of Soil Management and Legume Research Network Projects. Kenya Agricultural Research Institute, Nairobi, Kenya. Pp. 121-131.
- Handyanto, E., G. Cadisch, and K. E. Giller. 1994. Nitrogen release from prunings of legume hedgerow trees in relation to quality of the prunings and incubation method. Plant and Soil 160:237–248.
- Handayanto, E., Giller, K.E. & Cadisch, G. (1997).Regulating N release from legume tree prunings by mixing residues of different quality. Soil Biology and Chemistry, 29, 1417-1426.
- Harmon, M.E., Nadelhoffer, K.J. and J.M Blair (1999). Measuring decomposition, nutrient turnover and stores in plant litters. In standard soil methods for long term ecological research, ed G.P Robertson, D.C Coleman, C.S. Bledsoe and P. Sollins, 202-240.New York: Oxford University Press.
- Huancheng, M.A., and Z. Jueiming (1993). Effect of Tephrosia candida on soil. Nitrogen. Fixing Tree Research Reports. 11:127-128.
- Kamanga B, Kanyama-Phiri G, Snapp SS (2001) Experiences with farmer participatory mother baby trials and watershed management improve soil fertility options in Malawi. SoilFertNet Methods working paper No 5. CIMMYT, Harare, Zimbabwe
- Kuo, S. & Sainju, U.M. (1998). Nitrogen mineralisation and availability of mixed leguminous and non-leguminous cover crop residues in soil. Biology and Fertilisation of Soils, 26, 346-353.
- Kwabiah, A.B., Stoskopf, N.C. Voroney, R.P. and Palm, C.A. (2001). Nitrogen and phosphorus release from decomposing leaves under sub – humid tropical conditions Biotropica 33(2): 229 – 240.
- McDonagh, J.F., Toomsan, B., Limpinuntana, V. & Giller, K.E., (1995).Grain legumes and green manures as pre-rice crops in Northeast Thailand. II Residue decomposition. Plant and Soil, 177, 127-136.
- Musvoto, C., B. M. Campbell, and H. Kirchmann (2000). Decomposition and nutrient release from mango and miombo woodland litter in Zimbabwe. Soil Biology and Biochemistry 32:1111–1119.
- Myers, R.J.K., Palm, C.A. Cuevas, E. Gunatilleke, I.U.N. and Brossard, L. (1994). The synchronization of nutrient mineralization and plant nutrient demand. In: Woomer, P.L. and Swift, M.J. (eds.). The biological management of tropical soil fertility. Chichester, UK: Wiley-Sayce Publication. pp. 81 − 116.
- Nhamo, N., Martius, C. Wall, P.C. and Thierfelder, C. (2007). The fate of surface residue mulch during the dry winter and spring seasons in Zimbabwe. Conference on International Agricultural Research for Development. University of Kassel-Witzenhausen and University of Göttingen, 9-11thOctober, 2007.
- Nyamai, D.O. (1994). Investigations on decomposition of foliage of woody species using a perfusion method. Plant and Soil, 139, 239-245
- Palm, C. A. and Sanchez, P. A. (1991). Nitrogen release from the leaves of some tropical legumes as affected by their lignin and polyphenolic contents. Soil Biology and Biochemistry 28: 83 - 88.
- Paustian K., Agren, G. I. and Bosatta, E. (1997). Modeling litter quality effects on decomposition and soil organic matter dynamics. In: Cadisch, G and Giller, K.E (eds.). Driven by Nature: Plant litter quality and decomposition. CAB International, Wallingford, UK. pp. 313 − 335.
- Rutunga, V., Karanja, N.K. and Gachene, C.K.K. (2001). Decomposition rates of biomass obtained from six month-old Tephrosia vogelii, Tithonia diversifolia and natural fallow vegetation at Maseno, Kenya. Biological Agriculture and Horticulture,19:49-62.
- Saviozzi, A., Levi-Minzi, R. Riffaldi, R. and Vanni, G. (1997).Role of chemical constituents of wheat straw and pig slurry on their decomposition in soil. Biology and Fertility of Soils 25: 401 – 406.
- Schomberg, H.H., Steiner, J.L. and Unger, P.W. (1994). Decomposition and nitrogen dynamics of crop residues: Residue quality and water effects. Soil Science Society of America Journal 58: 372 – 381.
- Sing, B. Rengel, Z and J.W Bowden (2004). Canola residue decomposition: the effect of particle size on microbial respiration and cycling of sulphur in a sandy soil. Super soil.www.regional.org.au/au/assi
- Tetteh, F.M.K. (2004). Synchronizing nutrient release from decomposing organic materials with crop nutrient demand in the semi-deciduous forest zone of Ghana. Ph.D thesis. Faculty of Agriculture, KNUST, Kumasi. 185pp.
- Tripathi, S.K., and Singh, K.P., (1992). Nutrient immobilization and release patterns during plant decomposition in a dry tropical bamboo savanna, India. Biol Fertil Soils, 14, pp. 191-199.
- Vanlauwe B, Aman S, Aihou K et al. (1999) Alley cropping in the moist savanna of west Africa. III. Soil organic matter fractionation and soil productivity. Agroforestry Sytems 42: 245–264.
- Wang WJ, CJ Smith, D Chen (2004) Predicting soil nitrogen mineralization dynamics with a modified double exponential model. Soil Science Society of America Journal 68: 1256–1265.
- Zech, W., Senesi, N., Guggenberger, G., Kaiser, K., Lehmann, J., Miano, T.M., Miltner, A. & Schroth, G. (1997). Factors controlling humification and mineralization of soil organic matter in the tropics. Geoderma, 79, 117-161.


