
International Journal of Animal Biology, Vol. 1, No. 5, October 2015 Publish Date: Aug. 3, 2015 Pages: 249-252
Evaluation of Changes in Mitotic Index of Leukemia Cell Cultures in Different Time Periods
Swarupa R. Didla1, *, Jayanthi Undamatla2, Thelagathoti Conrad Diana3
1Department of Human Genetics, Andhra University, Visakhapatnam, A. P., India
2Department of Molecular Medicine Apollo Hospitals, Hyderabad, A. P., India
3Department of Zoology, Andhra University, Visakhapatnam, A. P., India
Abstract
Background: Mitotic index is a measure for the proliferation status of a cell population. The importance of the mitotic index (MI) as a prognostic factor in veterinary oncology has been emphasized recently. Materials and Method: The present data reveals that the mitotic index present in the leukemic-cell population in comparison to that of different time period over night cultures, 24 hrs cultures and 48 hrs cultures respectively. Lymphocyte culture from Leukemic blood and Bone marrow for 54 AML cases, 28 CML cases, 8 ALL cases, 2 CLL cases, 3 MDS cases and 5 other cases have been analysed by using the standard cytogenetic analytical tools. Results and Conclusion: The data derived from the three different time periods of cultures showed that relatively short period of time overnight cultures contains a large number of cells and good mitotic index. Our study shows that mitotic activity is an independent prognostic variable, possibly even more important than other biomarkers known and used in a clinical setting as indicators of risk.
Keywords
MI, RPMI 1640, AML, CML, ALL, CLL
Received: July 10, 2015
Accepted: July 20, 2015
Published online: July 31, 2015
@ 2015 The Authors. Published by American Institute of Science. This Open Access article is under the CC BY-NC license. http://creativecommons.org/licenses/by-nc/4.0/
1. Introduction
The vast majority of published cytogenetic studies of malignancy have been of leukemias and related hematologic disorders, cytogenetic abnormalities of leukaemias can help to define the diagnosis and to indicate clear prognostic differences [1]. Cytogenetic results were still regarded by many clinicians as being of peripheral interest. However, in all tumour types studied so far, the presence or absence of many of the genetic abnormalities found has been associated with different responses to treatment. Therefore, genetic and cytogenetic studies are being recognized as essential to the best choice of treatment for a patient. As a consequence of these advances, clinical colleagues now expect that cytogenetic analysis of malignancy will provide rapid, accurate, and specific results to help them in the choice of treatment and the management of patients. There is a greatly increased pressure on the cytogeneticist to provide results that fulfil these expectations. One of the major successes of cytogenetics in analysing leukemias is through mitotic index calculation [2].
Mitotic index is a measure for the proliferation status of a cell population [2]. The importance of the mitotic index (MI) as a prognostic factor in veterinary oncology has been emphasized recently. In the interesting exploratory study on canine cutaneous mast cell tumors, Preziosi et al [3] showed a significant association between MI and overall survival, which could be important for clinical decision making, especially in the case of Patnaik grade II tumors. The median survival time for with a tumor MI5 was significantly longer than for those with a MI, regardless of the grade. The cut-point applied in this study was based on the distribution of the MI, as well as on MI categories published for other tumour types [4]. Because the choice of the cut-point is critical in prognostic factor studies and because the clinical relevance of new prognostic indicators should always be investigated in an independent group Cell population growth occurs as cells pass through interphase and mitosis to complete the cell cycle [5]. Many cells lose the capacity to divide as they mature or divide only rarely. Other cells are capable of rapid cell division. The mitotic index can be calculated from a slide, even with light microscopy. It is the number of cells containing visible chromosomes (mitosis) per total number of cells in the field of view. A conventional cytogenetic study is still widely regarded as being the gold standard for genetic tests, since it is the best one currently available for assessing the whole karyotype at once [6]. It is subject to limitations, however, including those described below. Where these can be overcome by using one of the new technologies, this is mentioned. For most haematology cytogenetic studies the vastly preferred tissue is bone marrow [7]. Failures to produce a result can occur if the bone marrow sample is either very small or has an extremely high cell count. In either case, it is well worth asking for a heparinzed blood sample.
2. Methodology
2.1. Sample Collection
4mL Heparinized Peripheral blood and Bone marrow samples of haematologically positive 54 AML cases, 28 CML cases, 8 ALL cases, 2 CLL cases, 3 MDS cases and 5 other cases, collected from Department of Oncology, Apollo Hospital, Hyderabad.
2.2. Cell Culture
Fresh specimens were added to the RPMI 1640 medium (GIBCO) which contains 20% Fetal Bovine Serum (GIBCO), streptomycin and benzyl penicillin. Incubate the cultures at 37˚C for overnight, 24 hrs and 48 hrs. At the end of the incubation colchicin was added to the cultures and incubate for 20 min. Culture tubes were centrifuged 10 min at 1000g. Cell pellet resuspended in 5mL of freshly prepared prewarmed hypotonic solution (0.075M KCl) and incubated for 15 to 20 min. At the end of the hypotonic treatment a freshly prepared fixative solution (3:1 ratio of methanol and acetic acid) 0.5ml was added and centrifuged 10 min at 1000g. To the cell pellet 5mL of fresh fixative was added and centrifuged 10 min at 1000g. Fixative washes were repeated 3 -4 more times until the suspension no longer appear brownish. After the final fixative wash, the pellet was resuspended in 0.5mL of fresh fixative and drop the slides. And stained with Geisma’s stain and examined under the light microscopy to access the mitotic index. One way to quantify cell division is by using the mitotic index.
Mitotic index is calculated based on the given formula:
![]()
The present data reveals that the mitotic index present in the leukemic-cell population in comparison to that of different time period over night cultures, 24 hrs cultures and 48 hrs cultures respectively. Lymphocyte culture from Leukemic blood and Bone marrow for 54 AML cases, 28 CML cases, 8 ALL cases, 2 CLL cases, 3 MDS cases and 5 other cases.
3. Results
Cytogenetics findings supplement the more routine clinical and pathologic evaluations for the specific disease type. The data derived from the three different time periods of cultures showing that a relatively short period of time overnight cultures containing a large number of cells or good mitotic index.
Table 1. Shows the mitotic index of different leukemic cells in different time periods.
| Peripheral Blood | Bone marrow | |||||
| ON | 24 hr | 48 hr | ON | 24 hr | 48 hr | |
| CML | ||||||
| AVERAGE | 0.99 | 1.011111111 | 1.166666667 | 1.172727273 | 0.975 | 0.89375 |
| STDEV | 0.455704583 | 0.791271831 | 0.610327781 | 0.890789814 | 0.642391366 | 0.715978352 |
| VARIANCE | 0.207666667 | 0.626111111 | 0.3725 | 0.793506494 | 0.412666667 | 0.512625 |
| AML | ||||||
| MEAN | 0.451851852 | 0.766666667 | 0.385185185 | 0.83125 | 0.597453224 | 0.421160167 |
| STDEV | 0.789532661 | 1.649708599 | 0.491233693 | 0.83125 | 0.758333333 | 0.491666667 |
| VARIANCE | 0.623361823 | 2.721538462 | 0.241310541 | 0.326023936 | 0.356950355 | 0.177375887 |
| ALL | ||||||
| MEAN | 1.9 | 2.1 | 1.25 | 1.34 | 1.375 | 0.8 |
| STDEV | 1.697056275 | 1.838477631 | 1.626345597 | 0.482700735 | 0.602079729 | 0.479583152 |
| VARIANCE | 2.88 | 3.38 | 2.645 | 0.233 | 0.3625 | 0.23 |
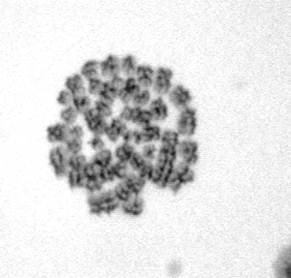
Fig. 1. Metaphase from overnight leukemic culture (100X).
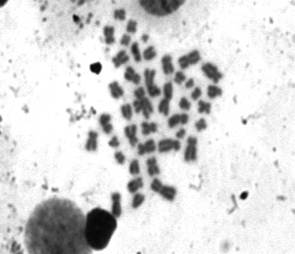
Fig. 2. Metaphase from 24hrs leukemic culture (100X).
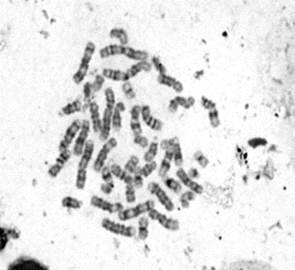
Fig. 3. Metaphase from 48hrs leukemic culture (100X).
4. Discussion
Bone marrow chromosome studies are important in the diagnosis and management of patients with leukemias. Blood samples generally have a much higher failure rate and lower clone rate than bone marrow; also, the divisions may derive from cells that left the bone marrow some time previously, and so do not represent the current state of the disease [8]. For all these reasons, blood samples may produce results that are more difficult to interpret. Therefore they should not be accepted willingly as an alternative to a good bone marrow sample, although they are better than nothing [9].
Cytogenetics studies of leukemias are technically difficult than the constitutional or non cancerous [10]. The chromosomes often are resistant to spreading and morphology is poor, with distinct bands. Several improvements in cell culturing, set different culture periods, harvesting and staining procedures can reduce these problems and lead to better identification of chromosomal abnormalities [11]. Culture periods are very much important for leukemic cultures.
In this data, we attempt to discuss the Mitotic index, which associated with three time periods of cell culture for leukemias from three prospective. In the first we list and present the mitotic index of 54 AML cases. In this section the statistical data showing that the peripheral blood 24hrs cultures mitotic index is relatively high when compare to the overnight cultures and 48 hrs cultures [7 & 8]. However, bone marrow cultures overnight and 24hrs culture’s mitotic index is relatively high when compare to the 48hrs culture’s mitotic index
In the second section, we list and present the mitotic index of 28 Chronic myeloid leukaemia cases. In this section the statistical data showing that, the 24hrs culture’s mitotic index is relatively high when compare to the overnight and 48hrs cultures. However, for Bone marrow cultures are more favourable for overnight cultures when compare to the 24hrs and 48hrs cultures.
In the third section, we list and present the mitotic index of 8Acute Lymphoblastic Leukaemia, 2 Chronic Lymphoblastic Leukaemia and 8 other cases. In this data revealing that, the overnight and 24hrs culture’s mitotic index is high when compare to the 48hrs culture. However, for Bone marrow cultures 24hrs culture’s mitotic index is high when comparing to the overnight and 48hrs cultures. Our study shows that mitotic activity is an independent prognostic variable, possibly even more important than other biomarkers known and used in a clinical setting as indicators of risk [12-16].
5. Conclusion
Cytogenetics findings supplement the more routine clinical and pathologic evaluations for the specific disease type. The data derived from the three different time periods of cultures showing that a relatively short period of time overnight cultures containing a large number of cells or good mitotic index.
Acknowledgement
The first author expresses her gratitude to the Department of Oncology, Apollo Hospital, Hyderabad for providing clinical samples.
References
- Killmann, S.A. Proliferative activity of blast cells in leukemia and myelofibrosis. Morphological differences between proliferating and non-proliferating blast cells. Acta med. scand. 1965, 178, 263.
- Japa, J. A study of the mitotic activity of normal human bone marrow. Brit. J. exp. Path. 1942, 23, 272.
- Preziosi R., G. Sarli and M. Paltrinieri, "Multivariate Survival Analysis of Histological Parameters and Clinical Presentation in Canine Cutaneous Mast Cell Tumours" Veterinary Research Communications, 31(3), 2007, PP. 287.
- Mauer, A. M., B. C. Lampkin, and E. F. Saunders. Kinetics of leukaemia cells. Proceedings of the XIth Congress of the International Society of Haematology. Plenary Sessions, Sydney, 1966, Sydney, Victor C. N. Blight, 1966, p. 42.
- Baserga, R. Mitotic cycle of ascites tumor cells. Arch. Path. 1963, 75, 156.
- Trask, B. J. Human genetics and disease: Human cytogenetics—46 chromosomes, 46 years and counting. Nature Reviews Genetics 3, 769–778 (2002) doi:10.1038/nrg905
- Mauer, A. M. Diurnal variation of proliferative activity in the human bone marrow. Blood 1965, 26, 1.
- Mauer, A. M., and V. Fisher. Comparison of the proliferative capacity of acute leukaemia cells in bone marrow and blood. Nature (Lond.) 1962, 193, 1085.
- Rubini, J. R., S. Keller, and E. P. Cronkite. In vitro DNA labeling of bone marrow and leukemic blood leukocytes with tritiated thymidine. 1. Physical and chemical factors which affect autoradiographic cell labeling. J. Lab. clin. Med. 1965, 66, 483.
- Baserga, R., and W. E. Kisieleski. Comparative study of the kinetics of cellular proliferation of normal and tumerous tissues with the use of tritiated thymidine. 1. Dilution of the label and migration of labeled cells. J. nat. Cancer Inst. 1962, 28, 331.
- Killmann, S. A., E. P. Cronkite, V. P. Bond, and T. M. Fliedner. Proliferation of human leukemic cells studied with tritiated thymidine in vivo. Proceedings of the VIIIth Congress of the European Society of Hematology, Vienna, 1961. Basel, S. Karger, 1962.
- Darbelley, N., D. Driss-Ecole, and G. Perbal. 1989. Elongation and mitotic activity of cortical cells in lentil roots grown in microgravity. Plant Physiological Biochemistry 27:341-347
- Driss-Ecole, D., D. Schoevaert, M. Noin, and G. Perbal. 1994. Densitometric analysis of nuclear DNA content in lentil roots grown in space. The Cell 81:59-64.
- Rudolph et al. (1998). "Correlation between mitotic and Ki-67 labeling indices in paraffin-embedded carcinoma specimens". Human Pathology 29: 1216–1222.
- Baak, J. P. A.; Gudlaugsson, E.; Skaland, I.; Guo, L. H. R.; Klos, J.; Lende, T. H.; Søiland, H. V.; Janssen, E. A. M.; Zur Hausen, A. (2008). "Proliferation is the strongest prognosticator in node-negative breast cancer: Significance, error sources, alternatives and comparison with molecular prognostic markers". Breast Cancer Research and Treatment 115 (2): 241–254.
- Urry et al. (2014). Campbell Biology in Focus. Pearson.


