
International Journal of Animal Biology, Vol. 1, No. 2, April 2015 Publish Date: Mar. 25, 2015 Pages: 28-37
Morphological Differentiation Between Isolated Populations of Caspian spirlin (Alburnoides eichwaldii) (Pisces: Cyprinidae) Affected by Dam
Fahime Azizi1, Hossein Anvarifar2, *, Hamed Mousavi-Sabet1
1Dept. of Fisheries, Faculty of Natural Resources, University of Guilan, SowmehSara, Guilan, Iran
2Dept. of fisheries, Faculty Animal Science and Fisheries, University of Agriculture and Natural Resources, Sari, Iran
Abstract
A 12-landmark morphometric truss network system and 12 meristic characters were used to investigate the hypothesis differentiation of Alburnoides eichwaldii populations in upstream and downstream of the Shahid-Rajaei dam on the Tajan River, one of the most important habitats for the species in the southern Caspian Sea region. Analysis of variance showed significant differences between the two groups of 16 out of 67standardized measurement in truss and 5 out of 16meristic. Discriminant function analysis, proportion of individuals was correctly classified into their original groups as 79% and 78.0% for truss and meristic, respectively. The spirlin populations occupied different areas on canonical variates analysis scatter plot. Cluster analysis based on Euclidean distances among groups of centroids using UPGMA did not separate the two populations. Principal Component analysis separated the groups into distinct populations; though there was moderate overlap between two localities. The results of this survey demonstrated that Shahid-Rajaee dam could effectively create two morphologically different populations upstream and downstream of the dam. Also, this differentiation showed higher in morphometric measurements than meristic traits.
Keywords
Population Differentiation, Truss Network System, Meristic, Caspian Sea, Iran
Received: March 6, 2015
Accepted: March 22, 2015
Published online: March 24, 2015
@ 2015 The Authors. Published by American Institute of Science. This Open Access article is under the CC BY-NC license. http://creativecommons.org/licenses/by-nc/4.0/
1. Introduction
Alburnoides eichwaldii is a small body cyprinid that inhabits mainly shallower areas with currents in sub alpine streams, where it forms small shoals. It prefers hard stony substrate and requires well-oxygenated and clear water (Penaz, 1995). As a rheophilous species living in the grayling and barbel zone, it is sensitive to the changes in the structural diversity of rivers (Breitenstein and Kirchhofer, 2000). This species in Tajan River in company with Capoeta capoeta gracilis are dominant in the southern Caspian Sea basin (Coad, 2008). Kiabi et al. (1999) examining Iranian material, considers the spirlin to be of least concern in the southern Caspian Sea basin according to IUCN criteria.Since Caspian spirlin is not of "economic value", our knowledge about this species remains rather poor in compare with many relative species.
On TajanRiverhas been constructed theShahid-Rajaei dam around 1995 with nofish way (Anvarifar et al., 2011) that is as major dam according to McAllister et al. (2001) classification. As a result of such construction, the river was effectively fragmented into two parts since the Shahid-Rajaee dam was built on it (Anvarifar et al., 2013). There have been many environmental impact reports where the construction of a dam can lead to dramatic changes in the environment and particularly can affect the diversity of fish communities (e.g. Adams, 2000; Craig, 2001, AnvariFar et al., 2011). It has been suggested that fragmentation of the river ecosystem alters migration patterns among fish populations (Horvath & Municio 1998; Jager et al., 2001), producing ‘genetic stocks’ that is reproductively isolated units and is genetically different from other stocks (Carvalho and Hauser, 1994). Previously, AnvariFar et al. (2011) reported that the Shahid-Rajaee dam on Tajan River has probably limited the downstream dispersal of Capoeta capoeta gracilis, and eliminated the upstream migration altogether leading to the formation of two morphologically different populations.
The study of morphological characters, whether morphometric or meristic, with the aim of defining or characterizing fish stock units, sometimes has been a strong interest in ichthyology (Tudela, 1999). In study of morphological traits, Truss network system (Strauss and Bookstein, 1982) covers the entire fish in a uniform network, and theoretically, it increases the likelihood of extracting morphometric differences between specimens (Turan, 1999; Kocovsky, 2009). There is evidence that the Truss method is much more powerful in describing morphological variation between closely related fish stocks (Jaferian et al., 2010; Cardin and Friedland, 1999).
Morphological studies carried out on Caspian Sea fishes show that many species possess speciation and population formation microprocess running, as Caspian and black sea species (Gholiev, 1997). There are several reports on southern Caspian Sea fishes including Samaee et al. 2006 and 2009; Rahmani and Abdoli 2008; Akbarzadeh et al. 2009; AnvariFar et al., 2011 and 2013 which indicate the existence of morphological variability in different parts of the Caspian Sea basin.However, the variability of this species and its spatial distribution has not been determined in this region and other parts of the world. On the other hand,molecular researches on Caspian species show that the Caspian spirlin existing in south Caspian Sea basin of Iran was different from other species of spirlin (Seifali et al., 2012).
Considering the above-mentioned facts, the present study was purpose to 1) investigate the impact of dam construction on the Tajan River, one of the most important habitats for Caspian spirlin in southern basin of the Caspian Sea, on possible differences between up- and downstream groups of Caspian spirlin using analysis of morphometric characters and meristic counts, 2) identify the best set of characters to establish the separation of the eventual groups.
2. Materialsand Methods
2.1. Sampling
A total of 100 individuals were collected by electrofishing from May to June 2011, from two sampling sites, including upstream (36°11ʹ N, 53°19ʹ E; 50 individuals) and downstream (36°16ʹ N, 53°12ʹ E; 50 individuals) of the Shahid-Rajaee dam (Fig. 1). The sampled fish were preserved in 10% formaldehyde solution and transported to the Department of Fisheriesof University of Guilan for further morphological analyses. This subset was used for analysis of variance (ANOVA) test of sexual dimorphism of Caspian spirlin. Ten to fifteen scales were removed from the left side of the body between the lateral line and dorsal fin and mounted under binocular microscope for age determination (Ambrose, 1989).
2.2. Laboratory Work
2.2.1. Truss Network System
A total of 67 distances between 12 landmarks were surveyed using truss network system according to Bookstein (1991) and Strauss and Bookstein (1982) with minor modification for this species (Fig. 2). Measurements of specimens were made by collecting X-Y coordinate data for relevant morphological features, and followed the three-step process as described below (Turan, 1999).Fishes were placed on a white board with dorsal and anal fins erected by pinning. The right body profile of each fish was photographed in 300-dpi, 32-bit color digital camera (IXY Digital 920 IS, Conan, Japan). Images were saved in jpg format and analyzed with TPSdig (Ver. 2.04; Rohlf, 2005) to coordinates of 12 landmarks. A box truss connecting these landmarks was generated for each fish to represent the basic shape of the fish (Cardin and Friedland, 1999). All measurements are transferred to a spreadsheet file in Excel 2007, and X-Y coordinate data were transformed into linear distances (using the Pythagorean Theorem) for subsequent analysis (Turan, 1999; AnvariFar, et al., 2011). Following image capture, fish sex was identified by dissecting dissection of the specimen and macroscopic examination of the gonads.
2.2.2. Meristic Counts
A number of 16 meristic variables based on Holcik et al. (1989), were count in each specimen by direct observation. Abbreviations used for meristic characteristics are: D1, Dorsal fin spines; D2, Dorsal fin branched rays; A1, Anal fin spines; A2, Anal fin branched rays; P1, Pectoral fin spines; P2, Pectoral fin branched rays; Pel1, Pelvic fin spines; Pel2, Pelvic fin branched rays; Ll, Lateral line scales; Squ.Sup, Scales above lateral line; Squ.Inf, Scales below lateral line; CP, Caudal peduncle scales; Ac, Around Caudal peduncle scales; Gr1, Outer gill rakers; Gr2, Inner gill rakers;Vn, Vertebrate number. To avoid human error all morphological measurement were performed by the same investigator.
2.3. Data Analysis
Morphometric characters describe aspects of body shape. In contrast to meristic characters, they are continuous variables and depend on body size. Thus, a key step in measuring morphometric characters is disentangling shape from size (Rohlf and Bookstein, 1987).To eliminate any size effect in the data set of truss network system, an allometric method (Elliott et al. 1995) was used to remove size-dependent variation in morphometric characters:Madj=M(Ls/L0)b; where M is original measurement, Madj is the size adjusted measurement, L0 is the standard length of the fish, Ls the overall mean of standard length for all fish from all samples in each analysis, and b was estimated for each character from the observed data as the slope of the regression of log M on log L0 using all fish in any group. The results derived from the allometric method were confirmed by testing significance of the correlation between transformed variables and standard length.
Analysis of Variance (ANOVA) was performed for each morphometric character to evaluate the significanceof difference between the two locations (Zar, 1984) and the morphometric characters which showed highly significant difference (P<0.01) only were used to achieve the recommended ratio of organisms number (N) measured to the parameters (P) included in the analysis to be at least 3-3.5 (Johnson, 1981; Kocovsky et al., 2009) for obtaining the stable outcome from multivariate analyses. In the present study linear discriminant function analyses (DFA), principal component analysis (PCA), canonical variates analysis (CVA) and cluster analysis (CA) were employed to discriminate the two populations. In meristic, only variables used for multivariate analysis that were polymorph and variables were monomorphic (without variance) discarded (in meristic analyses only polymorph variables were used for multivariate analyses and mesomorph variables were discarded). The resultant discriminant function was used to calculate the percentage of correctly classified (PCC) fish. A cross-validation using the DFA was done to estimate the expected actual error rates of the classification functions. As a complement to DFA, variables in truss variables and meristic traits between the individuals of two stations were inferred to cluster analysis (AnvariFar et al., 2011) by adopting the Euclidean distance as a measure of dissimilarity and the UPGMA (unweighted pair group method with arithmetical average) method as the clustering algorithm. Statistical analyses for morphological data were performed using the SPSSversion 16 software package (Quinn and Keough, 2002), Numerical Taxonomy and Multivariate Analysis System (NTSYS-pc) and Excel (Microsoft office, 2007).
3. Results
Age of Caspian spirlin specimens in upstream varied from 0+-3+ year and in downstream from 0+-2+ year (Table 1). Minimum, maximum, mean and standard deviation (S.D.) of length and weight were defined for male and female specimens upstream and downstream of the dam separately (Table 2).
There was no significant correlation between any of the transformed measured morphometric variables and standard length. (P>0.05) indicating that the size effect was accounted for Caspian spirlin specimens showed differences (P<0.01) upstream and downstreamin11 out of 67 standardized measurement (Table 3) and these characters that were significantly varied between 2 stations, did not shown significantly differences between sexes (p>0.05), were used in DFA, PCA, CVA and CA; hence, the data for both sexes were pooled for all subsequent analyses. Since in case of meristic counts Dorsal fin spines, Pectoral fin spinesand Pelvic fin spinestraits were monomorph, and Scales below lateral linewas meaningless therefore these traits were not used in subsequent analyses.
In PCA the characteristics with an eigenvalue of 1 were included and the rest were discarded.PCA of 11 traits in truss network systemand 12 traits in meristic showed that PC1 accounts for 35.78% and 18.91% of the variation and PC 2 for 18.96 and 13.34%, respectively (Table 4) and the most significant loadings on PC1 were 8-11, 9-10, Lateral line scales, around Caudal peduncle scalesand on PC2 2-8, 7-11, 8-9, Dorsal fin branched. Visual examination of plotted PC I and PC II scores for each sample (Fig. 3) revealed that two groupsof Caspian spirlin were distinct from each other in the regions, though there were slight overlap between two locations. The differentiation in truss network system was better than meristic counts.
For the DFA, the averages of PCC were 79% and 78% for truss and meristic traits, respectively. The Wilks' Lambda tests revealed differences among the two populations as their morphometric measurements were compared by discriminant analysis. In this test, one function were high significant in both system (P≤0.01) and Lambda values were 0.323 and 0.458 for truss network system and meristic traits, respectively. Correlations between the measured traits and the discriminant functions in morphometric measurements and meristic counts for Caspian spirlinare presented in Table 5. In truss network system high classification success rates were obtained for the upstream (80%) and downstream (78%) stocks indicates correct classification of individuals into their original populations with respect to morphometric characters. The measurements used in this analysisincluded 2-4, 2-5, 2-8, 2-12 and 8-9. In meristic counts classification success rates were obtained 74% and 82% for the upstream and downstream stocks, respectively, that indicates correct classification of individuals into their original populations. Also, the measurements used in this analysis included anal fin branched,pelvic fin branched, around caudal peduncle scales and anterior gill raker.In both morphometric and meristic characters the cross-validation testing procedure was the same as PCC results. Percentage of specimens classified in each group and after cross validation for truss network system and meristic data shown in table 6.
CVA confirmed significant differencesbetween populations (λ de Wilks= 0.42; P= 0). The scores of the two canonical variables for each population are shown in Fig.4. The CVA scatterplot showed the populations occupy different areas on the graph in both morphometric and meristic counts.
The dendrogram derived from cluster analysis of Euclidean distances between groups of centroids showed that the populations of Caspian spirlinfrom upstream and downstreamcould not separate into two populations; however differentiation in meristic counts was higher than morphometric measurements (Fig. 5).
Table 1. Age composition of Caspian spirlin in upstream and downstream of Shahid Rajaee dam on Tajan River
| Age | 0+ | 1+ | 2+ | 3+ |
| Upstream | 12 | 17 | 19 | 2 |
| Downstream | 19 | 25 | 6 | - |
Table 2. Descriptive data of Caspian spirlinin upstream and downstream of Shahid Rajaee dam on Tajan River
| Smaple | Sex | N | Min-Max(length) | Mean± S.D.(length) | Min-Max(weight) | Mean± S.D.(weight) |
| Upstream | Male | 21 | 35.47-74.65 | 60.4914±11.1390 | 0.94-11.04 | 5.7130±-2.8032 |
| Female | 29 | 33.74-83.01 | 59.4231±14.8860 | 0.79-15.58 | 6.2978±4.0118 | |
| Downstream | Male | 22 | 32.86-85.20 | 55.9152±15.5379 | 1.04-10.55 | 4.3052±2.1487 |
| Female | 28 | 35.87-66.64 | 54.3927±9.1551 | 0.73-15.77 | 5.2353±4.3802 |
Table 3. The results of ANOVA between stations for truss network system and meristic traits in Caspian spirlin samples on Tajan River
| Traits | Fvalue | Pvalue | Traits | Fvalue | Pvalue | Traits | Fvalue | Pvalue | Traits | Fvalue | Pvalue |
| 1-2 | 3.59 | 0.06 | 3-4 | 1.69 | 0.20 | 5-10 | 1.52 | 0.22 | 10-11 | 2.86 | 0.09 |
| 1-3 | 0.19 | 0.66 | 3-5 | 1.97 | 0.16 | 5-11 | 0.71 | 0.40 | 10-12 | 0.95 | 0.33 |
| 1-4 | 1.40 | 0.24 | 3-6 | 0.00 | 0.98 | 5-12 | 2.33 | 0.13 | 11-12 | 0.51 | 0.48 |
| 1-5 | 6.59 | 0.01 | 3-7 | 2.21 | 0.14 | 6-7 | 5.17 | 0.03 | D1 | - | - |
| 1-6 | 0.76 | 0.39 | 3-8 | 1.50 | 0.22 | 6-8 | 1.67 | 0.20 | D2 | 0.15 | 0.70 |
| 1-7 | 2.74 | 0.10 | 3-9 | 0.00 | 0.96 | 6-9 | 0.10 | 0.75 | A1 | 0.05 | 0.82 |
| 1-8 | 3.43 | 0.07 | 3-10 | 0.52 | 0.47 | 6-10 | 0.11 | 0.74 | A2 | 17.64 | 0.00 |
| 1-9 | 0.43 | 0.51 | 3-11 | 0.50 | 0.48 | 6-11 | 1.35 | 0.25 | P1 | - | - |
| 1-10 | 0.49 | 0.49 | 3-12 | 1.21 | 0.27 | 6-12 | 0.29 | 0.59 | P2 | 0.07 | 0.80 |
| 1-11 | 8.90 | 0.00 | 4-5 | 4.29 | 0.04 | 7-8 | 0.37 | 0.54 | Pel1 | - | - |
| 1-12 | 1.55 | 0.22 | 4-6 | 0.58 | 0.45 | 7-9 | 3.99 | 0.05 | Pel2 | 0.15 | 0.70 |
| 2-3 | 28.61 | 0.00 | 4-7 | 5.20 | 0.02 | 7-10 | 9.83 | 0.00 | L1 | 9.98 | 0.00 |
| 2-4 | 20.79 | 0.00 | 4-8 | 3.65 | 0.06 | 7-11 | 3.09 | 0.08 | Squ.sup | 14.12 | 0.00 |
| 2-5 | 2.25 | 0.14 | 4-9 | 0.53 | 0.47 | 7-12 | 11.52 | 0.00 | Squ.inf | 0.00 | 1.00 |
| 2-6 | 0.34 | 0.56 | 4-10 | 0.22 | 0.64 | 8-9 | 3.37 | 0.07 | Cp | 2.66 | 0.11 |
| 2-7 | 9.83 | 0.00 | 4-11 | 2.82 | 0.10 | 8-10 | 7.52 | 0.01 | Ac | 3.13 | 0.08 |
| 2-8 | 8.92 | 0.00 | 4-12 | 0.10 | 0.75 | 8-11 | 1.92 | 0.17 | Gr1 | 2.53 | 0.12 |
| 2-9 | 1.66 | 0.20 | 5-6 | 0.66 | 0.42 | 8-12 | 7.85 | 0.01 | Gr2 | 6.30 | 0.01 |
| 2-10 | 0.43 | 0.50 | 5-7 | 0.57 | 0.45 | 9-10 | 0.38 | 0.54 | Vn | 10.87 | 0.00 |
| 2-11 | 7.58 | 0.01 | 5-8 | 0.08 | 0.78 | 9-11 | 0.39 | 0.53 | |||
| 2-12 | 0.45 | 0.50 | 5-9 | 0.03 | 0.86 | 9-12 | 0.56 | 0.46 |
Table 4. Eigenvalues, percentage of variance and percentage of cumulative variance for the four and five principal components in case of truss network system and meristic counts respectively for Caspian spirlin samples from the Tajan River.
| Factor | Truss Network system | Meristic | ||||
| Eigenv. | Per. of v. | Per. Cu. v. | Eigenv. | Per. of v. | Per. Cu. v. | |
| PC 1 | 4.355 | 39.408 | 39.408 | 2.27 | 18.91 | 18.91 |
| PC 2 | 2.085 | 18.953 | 58.361 | 1.60 | 13.35 | 32.26 |
| PC 3 | 1.316 | 11.963 | 70.324 | 1.38 | 11.47 | 43.73 |
| PC 4 | 1.118 | 10.159 | 80.484 | 1.13 | 9.39 | 53.12 |
| PC 5 | - | - | - | 1.05 | 8.77 | 61.89 |
Table 5. Correlations between the measured morphometric variables and the discriminant functions in truss network system and meristic counts for Caspian spirlin
| Traits in Truss | DF | Traits in Truss | DF | Traits in Meristic | DF | Traits in Meristic | DF |
| 1-6 | 0.202 | 2-12 | 0.256 | D2 | 0.026 | Squ.sup | -0.49 |
| 2-3 | 0.487 | 7-11 | 0.205 | A1 | -0.038 | Cp | 0.019 |
| 2-4 | 0.497 | 8-9 | -0.315 | A2 | 0.548 | Ac | 0.004 |
| 2-5 | 0.423 | 8-11 | 0.028 | P2 | 0.023 | Gr1 | 0.136 |
| 2-8 | 0.291 | 9-10 | -0.146 | Pel2 | -0.061 | Gr2 | 0.328 |
| 2-9 | 0.234 | - | - | L1 | 0.156 | Vn | 0.430 |
Table 6. Percentage of specimens classified in each group and after cross validation for truss network system and meristic data.
| Station | Truss Network system | Meristic | ||||||
| Up. | Down. | Total | Up. | Down. | Total | |||
| Orginal | Count | Upstream | 41 | 9 | 50 | 40 | 10 | 50 |
| Downstream | 10 | 40 | 50 | 9 | 41 | 50 | ||
| % | Upstream | 82.0 | 18.0 | 100 | 80 | 20 | 100 | |
| Downstream | 20.0 | 80.0 | 100 | 18 | 82 | 100 | ||
| C. Validated | Count | Upstream | 40 | 10 | 50 | 37 | 13 | 50 |
| Downstream | 11 | 39 | 50 | 9 | 41 | 50 | ||
| % | Upstream | 80.0 | 20.0 | 100 | 74 | 26 | 100 | |
| Downstream | 22.0 | 78.0 | 100 | 18 | 82 | 100 | ||

Fig. 1. Location of sampling sites Upstream and Downstream on of Tajan River southern Caspian Sea- Mazandaran coasts.
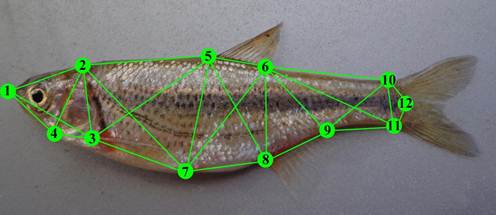
Fig. 2. Image of a Caspian spirlin depicting 12 landmarks and associated box truss used to infer morphological differences among populations. 1: Tip of snout; 2: Forehead (end of frontal bone); 3: Dorsal origin of pectoral fin; 4: Origin of isthmus; 5: Origin of dorsal fin; 6: Termination of dorsal fin; 7: Origin of pelvic fin; 8: Origin of anal fin; 9: Termination of anal fin 10: Dorsal side of caudal peduncle, at the nadir; 11: Ventral side of caudal peduncle, at the nadir; 12: End of lateral line (Adapted from truss box, after Strauss and Bookstein, 1982 and Bookstein, 1991).
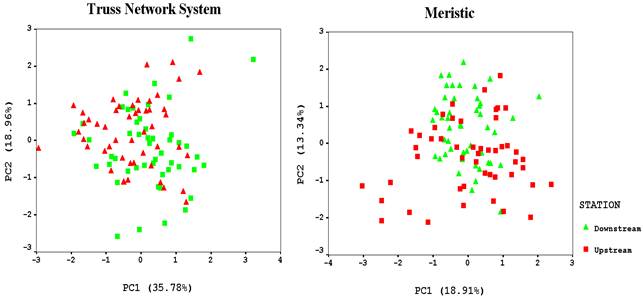
Fig. 3. Plot of the factor scores for PC1 and PC2 in truss network system and meristic characters for Caspian spirlin in upstream and downstream of the Shahid-Rajaei dam on the Tajan River.
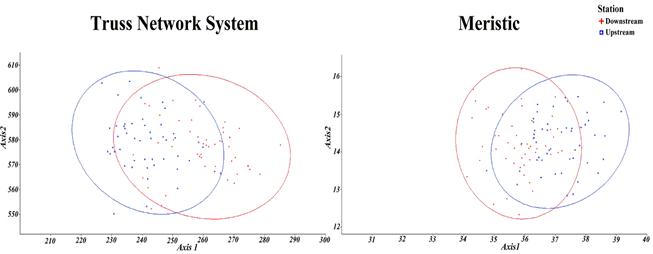
Fig. 4. Results of Canonical Variable Analysis, showing the relative position of each population for Caspian spirlin in truss network system and meristic characters.

Fig. 5. Dendrogram derived from cluster analyses of 25 traits in truss network system and 12 meristic traits in on the basis of Euclidean distance for Caspian spirlin in upstream and downstream of the Shahid-Rajaei dam on the Tajan River.
4. Discussion
This study focused on identifying the differences betweenCaspian spirlinpopulations inhabiting upstream and downstream of Shahid-Rajaee dam on the basis of morphological polymorphisms.The investigation was not looking for the differentiation mechanisms (environmental parameters or genetics). In Azerbaijan, maturity of Caspian spirlin is attained at 1-2 years and life span is 3 years (Coad, 2008). Hence, since establishing the Shahid-Rajaee dam, at least generated 7 generation of this fish in Tajan River. The analysis of variance revealed significant phenotypic variation between populations (16 out of 67 morphometric characters). The result of the multivariate analysis 11 truss variables showed differences between upstream and downstream of Shahid-Rajaee dam on Tajan River. These negative effects on fish species may end in an ecological trap for migratory fishes that ascend the fish passages, as populations will not succeed upstream (Pelicice and Agostinho, 2008; Anvarifar et al., 2013). Unweightpair group using arithmetical average (UPGMA) drawing based on Euclidian Distance coefficient for morphometric and meristic characters revealed that although Caspian spirlinpopulations overlap in two stations however population somewhat differentiated (Fig. 5).
The detected high morphometric and meristic differentiation may indicate reproductive isolation between upstream and downstream samples. The causes of morphological differences between populations are often quite difficult to explain (Cadrin 2000; Poulet et al. 2004). As morphology is especially dependent on environmental conditions during early life history stages (Lindsey 1988), phenotypic differentiation may indicate that the majority of fish spend their entire lives in separate locations (Turan et al. 2006). It has been suggested that the morphological characteristics of fish are determined by an interaction between genetic and environmental factors (Swain & Foote 1999; Poulet et al. 2004; Salini et al. 2004; Pinheiro et al. 2005). The phenotypic variability may not necessarily reflect population differentiation at the molecular level (Ihssen et al. 1981; Tudela 1999). When a species has a more or less continuous distribution across a range, the balance between gene flow and the forces responsible for population differentiation, such as genetic drift or differential selection, may result in clines, whereby genetic differentiation increases with geographic distance (Borsa et al. 1997; Pinheiro et al. 2005). AnvariFar et al. (2011) did same study in this river on another species. They used from truss and stated different environment condition and decrease of gene flow caused created two distinct populations of Capoetacapoeta gracilis.
The influences of environmental parameters on morphometric characters are well discussed (e.g. Swain, & Foote 1999; Smith 1966; Turan 2000). Cardin and Friedland (1999) and Poulet et al. (2005) stated geographical isolation can result in the development of different morphological features between fish populations because the interactive effects of environment, selection, and genetics on individual ontogenies produce morphometric differences with in a species. Smith (1966), Lindsey (1988) and Turan (2000) stated morphological variation between fish populations is influenced by a mixture of environmental factors that include but are not limited to temperature, salinity, radiation, dissolved oxygen, water depth and current flow. Salles and Freitas (2006) stated morphometric discrimination between the two stocks of Caribbean red snapper, Lutjanus purpureus Poey, 1867, in northern Brazil is probably a result of the feeding/reproductive strategies adopted in each of their respective subareas. Samaee et al. (2006) stated different environmental and habitat conditions, such as temperature, turbidity, food availability, and water depth and flow in different river are caused differentiation in Capoeta sp. population. Hence effects of some environmental factors such as temperature, salinity, food availability and migration distance can potentially determine morphometric segregation of fish (Smith 1966; Lindsey 1988; Turan 2000; Turan et al. 2004, Turan et al. 2006). In this study geographical separation by dam, high inbreeding and different environmental factors probably created morphologically different populations of Alburnoides eichwaldii, because of their limited dispersal and migration.
It is well known that morphological characteristics can show high plasticity in response to differences in environmental conditions (Swain et al. 1991). Phenotypic plasticity of fish allows them to respond adaptively to environmental change by modification in their physiology and behavior which leads to changes in their morphology, reproduction or survival that mitigate the effects of environmental variation (Meyer, 1987; Turan, 1999).The environmental characteristics prevailing during the early development stages, when individuals are more phenotypically influenced by the environment, are of particular importance (Tudela 1999; Pinheiro et al. 2005) especially in case of meristic characters (Weisel 1955; Lindsey 1988). In this reason meristic traits show less differentiation via morphometrics. Ihssen et al. (1981) and Turan (1999) stated the predictive abilities of morphometric and meristic characters differ statistically and are likely to be lower for the meristic characters thus, morphometric data should be analyzed separately from meristic data in multivariate analyses. It has seems isolation by distance to be the mechanism responsible for population differentiation of Caspian spirlin. Morphometric and meristic characters are only partially genetically determined and are strongly influenced by environmental conditions (e.g. Ihssen et al., 1981; Lindsey, 1988).
Body shape in fishes is generally thought to reflect adaptation to their ecological niches (Swain et al., 2005). Poulet et al. (2004) used morphometric and meristic features and they found that the truss network method was more efficient than meristics in discriminating between the subpopulations.Unlike meristic characters, which are fixed early in life, morphometric characters may be labile to environmental influences throughout life (Wainwright et al., 1992).Meristic characters are influences by a wide variety of environmental factors including salinity, light, and dissolved oxygen (Lindsey, 1988).
In conclusion, with regard to our morphological results, it could be said that the most important reason for the presence of two distinct populations of Caspian spirlin in downstream and upstream of Tajan River would be the Shahid-Rajaee dam, which was constructed on the river. To determine the contribution of genetics in differences in morphological findings, further investigation is necessary using DNA techniques. It is suggested to use molecular markers with high polymorphism, such as microsatellite to detect population differentiation.
Acknowledgements
Special thanks to Imanpoor Naminfor reviewing the manuscript and making suggestions.
References
- Akbarzadeh A., Farahmand H., Shabani A. A., Karami M., Kaboli M., Abbasi K. and Rafiee G.R., 2009.Morphological variation of the pikeperch Sander lucioperca (L.) in the southernCaspian Sea, using a truss system. J ApplIchthyol, 25, 576–582.
- Ambrose J.J.R., 1989. Fisheries Techniques. Edt. Larry A. Nielson and David L. Johnson. Blackburg, Virgina, USA, p. 301–325.
- AnvariFar H., Khyabani A.R.,Farahmand H., Vatandoust S., AnvariFar H. andJahageerdarS., 2011. Detection of Morphometric Differentiation between Isolated up- and downstream Populations of Siah Mahi (Capoeta capoetagracilis) (Pisces: Cyprinidae) in the Tajan River (Iran). Hydrobiologia, 673(1), 41–52. http://dx.doi.org/10.1007/s10750-011-0748-7
- AnvariFar H., Farahmand H.,Silva D.M., BastosR.P. andAnvariFar H.,2013. Fourteen years after the Shahid-Rajaei dam construction: an evaluation of the morphometric and genetic differentiation between isolated up- and downstream populations of Capoeta Capoetagracilis (Siah Mahi, Pisces: Cyprinidae) in the Tajan River (Iran). GMR, 12, 3465–3478.
- Borsa P.,Blanquer A. andBerrrebi P., 1997. Genetic structure of the flounders Platichthysflesusand P. stellatusat different geographic scales. MAR BIOL, 129, 233–246. http://dx.doi.org/10.1007/s002270050164
- Breitenstein, M.E. andKirchhofer, A. (2000) Growth, age structure and species association of the cyprinid Alburnoides bipunctatus in the River Aare. FOLIA ZOOL, 49, 59–68.
- Cadrin S.X., 2000. Advances in morphometric analysis of fish stock structure. REV FISH BIOL FISHER, 10,91–112.
- Coad B.W., 1980.Environmental change and its impact on the freshwater fishes of Iran. BIOL CONSERV, 19,51–80. http://dx.doi.org/10.1016/0006-3207(80)90015-4
- Coad B.W., 2008. Freshwater Fishes of Iran. Available at http://www.briancoad.com (accessed on 5 May 2010).
- Elliott N.G.,Haskard K. andKoslow J.A., 1995. Morphometric analysis of orange roughy (Hoplostethusatianticus) off the continental slope of Southern Australia. J FISH BIOL, 46,202–220. http://dx.doi.org/10.1111/j.1095-8649.1995.tb05962.x
- GholievF., 1997.Cypriniformes and Perciformes in Caspian Sea. (Translated from Russian to Farsi by Adeli, Y.) Iranian Fisheries Research and Training Organization. 61 pp. [in Farsi].
- Holcik J.,Banarescu P. and Evans D., 1989. General introduction to fishes. In: Holcik, J. (Eds), The freshwater fishes of Europe,pp. 19–59. ALUA Verlag, Wiesbaden.
- Ihssen P.E., Evans D.O., Christie W.J., Rechahn J.A. andDesJardineD.L., 1981. Life history, morphology, and electrophoretic characteristics of five allopatric stocks of lake whitefish (Coregonusclupeaformis) in the Great Lakes region. CAN J FISH AQUAT SCI,38, 1790–1807. http://dx.doi.org/10.1139/f81-226
- Jaferian A., Zolgharnein H., Mohammadi M., Salari-Aliabadi M.A. and Hossini, S.J., 2010. Morphometric study of Eleutheronenmateradactylum in persian Gulf based on the Truss Network. World J FISH MAR SCI, 2, 499–504.
- Lindsey C.C., 1988. Factors controlling meristic variation. In: (Eds W.s. Hoar& D.JRandall), Fish Physiology, vol. 11-B. Academic Press, San Diego, CA, pp. 197–274.
- Kiabi B.H., Abdoli A. andNaderi M., 1999. Status of the fish fauna in the South CaspianBasin of Iran. ZOOL MIDDLE EAST, 18, 57–65. http://dx.doi.org/10.1080/09397140.1999.10637782
- Penaz M., 1995. Alburnoides bipunctatus. In: Baruš V. &Oliva O. (eds), Mihulovci a ryby (2). (Lampreys and Fishes.) Fauna ČR a SR , Vol. 28/2. Academia Praha, 698 pp. (in Czech with English summary).
- Pinheiro A., Teixeira C.M.,Rego A.L, Marques J.F. and Cabral H.N., 2005.Genetic and morphological variation of Solealascaris (Risso, 1810) along the Portugese coast.FISH RES, 73, 67–78.
- Poulet N.,Berrebi P.,Crivelli A.J.,Lek S. andArgillier C., 2004. Genetic and morphometric variations in the pikeperch (Sander lucioperca L.) of a fragmented delta. Arch. Hydrobiol. 159, 531–554. http://dx.doi.org/10.1127/0003-9136/2004/0159-0531
- Quinn G.P. and Keough M.J., 2002. Experimental desingn and data analysis for biologist, 527 pp.
- Rahmani H. and Abdoli A., 2008. Inter- population morphological diversity in Vimba vimba persa (Pallas,1814) in Gorganrud river, Shirud river and Anzali lagoon. J AGR SCINATRESOUR, 15(1). [in Farsi].
- Rohlf F.J., 2005. TPS Dig, Version 2.04. Department ofEcology and Evolution, State University of New York,Stony Brook.
- Rohlf F.J. and Bookstein F.L., 1987. A comment on shearing as a method for size correction. SYSTZOOl, 36, 356–367. http://dx.doi.org/10.2307/2413400
- Salini J.P., MiltonD.A, Rahman M.JandHussain M.G., 2004.Allozime and Morphological variation throughout the geographic range of the tropical shad, hilsa (Tenualosailisha). FISH RES, 66, 53–69. http://dx.doi.org/10.1016/S0165-7836(03)00124-3
- Samaee S.M., Mojazi-Amiri B. andHosseini-Mazinani S.M., 2006. Comparison of Capoeta capoetagracilis (Cyprinidae, Teleostei) populations in the south Caspian Sea River basin, using morphometric ratios and genetic markers.FOLIA ZOOL,55, 323–335.
- Seifali M., Arshad A., YazdaniMoghaddamF., Esmaeili H., Kiabi B.,KhalijahDaudS. and AliabadianM., 2012.Mitochondrial Genetic Differentiation of spirlin (Actinopterigii: cyprinidae) in the south caspian sea basin of Iran. EVOLBIOINFORM, 8: 219–228. http://dx.doi.org/10.4137/EBO.S9207
- Smith G.R., 1966. Distribution and evolution of the North American catostomid fishes of the subgenus Pantosteus, genus Castostomus. Miscellaneous ublications, Museum of Zoology, University of Michigan, p. 129.
- Strauss R.E. and Bookstein F.L., 1982. The truss: body form reconstruction in morphometrics. SYST ZOOL, 31, 113–135. http://dx.doi.org/10.2307/2413032
- Swain D.P. and Foote C.J., 1999. Stocks and chameleons: The use of phenotypic variation in stock identification. FISH RES, 43, 113–128. http://dx.doi.org/10.1016/S0165-7836(99)00069-7
- Swain D.P., Ridell B.E. and Murray C.B., 1991. Morphological differences between hatchery and wild populations of coho salmon (Oncorhynchuskisutch): environmental versus genetic origin. CAN J FISH AQUAT SCI,48, 1783–1791. http://dx.doi.org/10.1139/f91-210
- Swain D.P., Hutchings J.A. and Foote C.J., 2005. Environmental and genetic influences on stock identification characters. In: Cadrin S. X., Friedland K. D., Waldman J. R., editors. Stock Identification Methods, Applications in Fishery Science. London: Academic Press, 45–85. 719pp.
- Tudela S., 1999. Morphological variability in a Mediterranean, genetically homogeneous population of the European anchovy, Engraulisencrasicolus. FISH RES, 42, 229–243. http://dx.doi.org/10.1016/S0165-7836(99)00052-1
- Meyer A., 1987. Phenotypic plasticity and heterochrony in Cichlasomamanaguense (Pisces, ciclidae) and their implication for speciation in cichlid fishes. Evolution 41, 1357–1369.
- Turan C., 1999. A note on the examination of morphometric differentiation among fish populations: the truss system. TURK J ZOOL, 23, 259–263.
- Turan C., 2000. Otolith shape and meristic analysis of Herring (Clupea harengus) in the northeast Atlantic. ARCH FISH MAR RES, 48, 283–295.
- Turan C. andErguden D., 2004. Genetic and morphometric structure of Liza abu (Heckel, 1834) population from the Rivers Orontes, Euphrates and Tigris. TURKJ VET ANIM SCI, 28, 729–734.
- Turan C., Oralzturk B.O. andDuzgunes E., 2006. Morphometric and meristic variation between stocks of Bluefish (Pomatomussaltatrix) in the Black, Marmara, Aegean and northeastern Mediterranean Seas. FISH RES, 79, 139–147. http://dx.doi.org/10.1016/j.fishres.2006.01.015
- Weisel G.F., 1955. Variations in the number of fin rays of two cyprinid fishes correlated with natural water temperature. ECOLOGY, 36, 1–6. http://dx.doi.org/10.2307/1931422


