
Agricultural and Biological Sciences Journal, Vol. 1, No. 5, October 2015 Publish Date: Jul. 20, 2015 Pages: 197-205
Evaluation of Plant Diversity and Nutrient Resource on Weed Diversity and Soil Microbial Respiration
Elham Azizi1, *, Alireza Koocheki2, Parviz Rezvani-Moghadam2, Mehdi Nassiri-Mahallati2, Mansoureh-Sadat Sharifi-Noori1
1Department of Agronomy, Payame Noor University, Tehran, Iran
2Department of Agronomy, Faculty of Agriculture, Ferdowsi University of Mashhad, Mashhad, Iran
Abstract
In order to investigate the effects of plant diversity and nutrient resource on weed composition, density and dry matter, an experiment was conducted as split plot based on complete randomized block design with 3 replications at the Agricultural Research Station, Ferdowsi University of Mashhad, Iran, during 2006 and 2007. Treatments included manure and chemical fertilizers as main plots and intercropping of 3 soybean varieties (Wiliams, Sahar and Gorgan3), intercropping of 3 Millet species (Common millet, Foxtail millet and Pearl millet), intercropping of Millet, Soybean, Sesame (Sesamum indicum) and intercropping of Millet, Sesame, Fenugreek (Trigonella foenum-graecum), Ajowan (Trachyspermum ammi) as sub plots. Result indicated that nutrient resource affected weed dry matter and density. Weed dry matter and density was respectively, 1.3 and 1.8 folds higher in chemical fertilizer compared to manure in first year. In the second year, weed dry matter in manure and chemical fertilizers was 173.2 and 300.2 g.m-2 and weed density was 98.6 and 84.9 plants per square meter. With increasing crop diversity, weed dry matter and density decreased and intercropping systems had the lowest weed dry matter. Crop species affected weed dry matter in monocultures. There was a negative correlation between diversity and weed dry matter. In the first year Shannon diversity index was highest in sesame and Ajowan monocultures (0.75 and 0.72, respectively). Different intercropping systems had the lowest Shannon index. In the second year, Shannon index was highest in soybean (Sahar variety) monoculture (0.72) and 3 Millet species intercropping (0.71). More researches on the effects of crop diversity on weed population are needed in mixed intercropping. With increasing crop diversity, soil microbial respiration was increased. Also, there was positive significant regression between weed Shannon index and soil microbial respiration.
Keywords
Weeds, Species Diversity, Intercropping, Shannon Index, Soil Microbial Respiration
Received:June 1, 2015
Accepted: June 10, 2015
Published online: July 16, 2015
@ 2015 The Authors. Published by American Institute of Science. This Open Access article is under the CC BY-NC license. http://creativecommons.org/licenses/by-nc/4.0/
1. Introduction
Agroecosystems are ecological systems are organized for agricultural products. Their products were determined based on using external inputs (1, 2). The result of simplification and decreased diversity is making artificial systems that require human intervention, whereas in natural ecosystems, internal regulation is obtained by plant diversity (5). Simplification of agroecosystems was created through incorrect crop rotation, monocultures, same genotypes of crops and weed eradication by chemical herbicides which lead to weed and pest resistance and environmental pollution (18, 26, and 28). However, increasing biodiversity, diverse management methods and using mixture of varieties decrease disturbance by insects and weeds in agroecosystems (2, 18).
In general, increasing diversity raises inherent complexity of agroecosystems and encourages its processes (1). Altieri (5) demonstrated that internal regulation of function in agroecosystems is largely dependent on plant and animal biodiversity. Biodiversity in agroecosystems performs a variety of ecological services beyond the production of food. These services include recycling of nutrients, regulation of microclimate and local hydrological processes, suppression of weeds, pests and diseases and detoxification of noxious chemicals. Tengberg (25) indicates that diversity of agricultural systems, agricultural species and main species are three component of agrobiodiversity. Multiple cropping, especially intercropping, is one way to increase agroecosystems diversity (18). In diverse agroecosystems ecological niches occupied by useful species and invasive species were not observed (2, 4). Baummann et al, (11, 12) discovered that intercropping of crops with weak competitive ability, such as onion (Allium cepa L.), leek (Allium porrum L.) and carrot (Daucus carota L.), may be necessary to reach a level of weed control. They observed that biomass and seed production potential of weed in intercropping was lower than monoculture due to increasing canopy light interception and competitive ability in intercropping. Baummann et al, (10) showed that an important problem of organic agriculture is weed management. They mentioned the approach for weed and pest management in organic agriculture is intercropping systems and mulch. Renne et al (22) demonstrated that with increasing species diversity in pastures, weed frequency decreased. Also, forage species composition affected weed diversity. It is obvious that in intercropping with Festuca arundinacea Schreb, shoot dry weight and weed seed bank was lower than intercropping with Bromus inermis. Based on the effect of a short-term spring-seeded smother plant on corn development and weed control, De Haan et al (13) expressed that herbicide application and current tillage can be replaced with cover crop between crop rows. They showed that spring seed-smother crop decreased weed density about 80% with minimum effects on corn yield. Hafman et al (14) discovered that the biomass of cover crop could decreased about 96% without corn growth prevention. Kegod et al (15) indicated that crop rotation incased weed diversity rather than continues crop cultivation. Yin et al (27) showed that the types of nutrient resource including manure and chemical fertilizer did not affect weed community significantly but the types and amount of fertilizer nutrient changed weed diversity and composition.
There are also studies that indicated that the plant species and numbers can drive the makeup of the microbial community and the diversity of rhizosphere microbial population (12, 29) investigated the effects of fertilizer treatments on the functional diversity of soil microbial communities in tea plantations. They indicated that intercropping and organic matter fertilizer improved the abundance and diversity of soil microbes to a certain extent. Yang et al. (30) demonstrated that multiple-cropping forage rape with wheat could significantly increase soil microbial biomass C., soil microbial biomass N., soil bacteria number, soil fungi number and soil actinomyces number, but decrease soil microbial biomass C/N.
In this study, the effect of plant diversity and nutrient resource on weed diversity and soil microbial respiration was investigated.
2. Material and Method
This experiment was conducted as split plot based on complete randomized block design with 3 replications at the agricultural research station, Ferdowsi University of Mashhad, Iran, during 2006 and 2007. Treatments included manure and chemical fertilizers (equivalent to nutrient in manure) in main plots and different cropping systems in subplot. Sheep manure was applied as organic input amount to 20 ton per hectare (Table1). Inorganic input included urea, triple super phosphate and potassium sulfate equal to macro nutrients (NPK) in manure.
Table 1. Soil and manure characteristics in 2006 and 2007.
| Texture | Electerical Conductivity (ds.m-1)* | pH | Potassium (ppm) | Phosphorus (ppm) | Nitrogen (%) | Nutrient resources | Growing season |
| Loam | 2.99 | 7.1 | 110.11 | 14.00 | 0.05 | Soil | 2005-2006 |
| - | - | - | 171.06 | 168.12 | 1.23 | Manure | |
| Loam | 2.08 | 7.7 | 8.60 | 20.92 | 0.07 | Soil | 2006-2007 |
| - | - | - | 2992.50 | 276.07 | 1.28 | Manure |
* desi siemens per meter
Different cropping systems were designed based on the kinds of diversity:
-Species diversity: intercropping of 3 Millet species included Common millet (Panicum miliaseum L.), Foxtail millet (Setaria italica L.) and Pearl millet (Pennisetum glaucum L.)
-Genetic diversity: intercropping of 3 soybean (Glysin max L.) varieties included Wiliams, Sahar and Gorgan3
-Functional diversity: intercropping of Millet, Soybean, Sesame (Sesamum indicum) and intercropping of Millet, Sesame, Fenugreek (Trigonella foenum-graecum L.), Ajowan (Trachyspermum ammi)
-Monoculture of plants
Agricultural operations included plowing, disc, leveling the ground. Plants were sowed in plots. In intercropping treatments, seeds were sowed as mixed cropping based on additive design.
The length and wide of main plots were 71 and 3 meter respectively. Sub plots were 5×3 meter.
A-Determining weed diversity
In order to determine weed diversity in different treatments, the part of plots remained as weed infested in the early growth season. The measurements were conducted when 80% radiation was absorbed by plant canopy. For sampling, 2 plots with 25×25 cm dimensions were used. The type, density and dry weight of weeds was defined. Shanon index (H) and Margalof index (M) were used for defining weed diversity
(1) ![]()
![]()
N: number of total individuals n: number of individuals in a species
Pi: Relative frequency for a species
(2) ![]()
S: number of species and N: number of total individuals
B- Determining microbial respiration
In order to measure microbial respiration, 50 g of soil was added to beaker and put on in a big container including NaOH 0.05 N. Then containers were closed with paraffin completely. After five days, remained NaOH in containers were titrated by HCl 0.05 N and adding Bacl2 0.5 M and phenolphthalein.
CO2= (V HCl in control-V HCl in treatment) ×N acid×22
Data analysis was carried out using SAS, MINITAB, and EXCEL. Means comparison was conducted by Duncan test.
3. Results and Discussion
In different cropping systems, 14 and 12 weed species were observed in first and second growing season respectively. Functional groups of important species are mentioned in table2.
Among weed species, the highest dry weight was obtained in Digitaria sp., Echinocloa crusgalli and Cyperus rotundus. Dry weight mean of three weed species were 60.7, 52.6 and 13.4 g. m-2in first growing season and 53.2, 93.3 and 39.5 g. m-2 insecond growing season respectively. Probably these weeds dominant was due to plot cultivation and water retention in plot for a long time (table 3).
The highest density was obtained in Cyperus rotundus with 20 and 50 plant/m2 in first and second growing season respectively. Weed density was affected by cropping systems. The means of weeds density in intercropping treatment was lower than in monocultures (table4). Dry weight and total density of weed were affected by kind of nutrient resource significantly. In two growing season, weeds dry weight and density under inorganic fertilizer were higher than organic conditions (table5). In general, nutrient affect crop quality and quantity by changing plant and weed competition relationships. Mahn (16) reported that changing available nitrogen amount affected crop growth and weed density. Salas et al, (23) showed that fertilizer kind and composition could affect weed reaction. Schreiber (24) reported that different species of a weed genus had different reaction to nutrients. Yin et al (27) demonstrated that nutrient resource kind including chemical and manure fertilizer had not significant effect on weed communities but kind and amount of nutrient added to soil by different nutrient resources, changed weed diversity and composition. Chemical fertilizer application, especially nitrogen fertilizer, affected weed diversity and composition. They indicated that with increasing nitrogen fertilizer, competition between weeds and crops for light absorption increased. The success of weed depended on higher capture ability for available nitrogen to increase height. In a long time, it leads to nitrophyl species dominance such as Chenopodium album and Avena fatua (3, 8).
Table 2. Functional groups of weed in different cropping systems.
| Vegetative cycle | Photosynthetic pathway | Vegetative form | species |
| Perennial | C3 | dicotyledonous | Convulvulus arvensis |
| annual | C3 | dicotyledonous | Sonchus arvensis |
| Perennial | C4 | monocotyledonous | Cyperus rotundus |
| annual | C4 | monocotyledonous | Echinocloa crus-galli |
| annual | C4 | monocotyledonous | Digitaria sp. |
| annual | C3 | dicotyledonous | Solanum nigrum |
| annual | C4 | dicotyledonous | Amaranthus retroflexus |
| annual | C4 | dicotyledonous | Amaranthus blitoides |
| annual | CAM | dicotyledonous | Portulaca oleracea |
| annual | C3 | monocotyledonous | Setaria viridis |
Table 3. Dry weight of important weed species (g.m-2) in different cropping systems during 2005-2006 and 2006-2007.
| 2005-2006 | ||||||||||||||
| species | pan | pen | set | soyw | soys | soyg | se | tri | tra | pps | sss | pss | pstt | |
| Convulvulus arvensis | 0.03 | 0.00 | 1.78 | 4.51 | 0.15 | 8.29 | 5.30 | 12.48 | 4.78 | 4.14 | 0.46 | 1.17 | 7.71 | |
| Sonchus arvensis | 0.00 | 16.86 | 0.00 | 0.00 | 0.00 | 0.00 | 1.88 | 0.61 | 9.62 | 0.00 | 0.00 | 0.33 | 0.00 | |
| Cyperus rotundus | 36.05 | 0.00 | 51.99 | 52.80 | 0.00 | 1.34 | 4.96 | 17.64 | 3.12 | 0.00 | 1.38 | 0.33 | 4.10 | |
| Echinocloa crus-galli | 54.99 | 16.06 | 90.49 | 76.06 | 48.54 | 14.81 | 5.70 | 108.39 | 116.81 | 43.12 | 33.46 | 39.38 | 36.03 | |
| Digitaria sp. | 13.07 | 91.08 | 24.56 | 51.02 | 26.89 | 78.94 | 95.60 | 39.92 | 84.22 | 118.62 | 73.17 | 24.98 | 66.58 | |
| Solanum nigrum | 0.32 | 3.65 | 2.12 | 7.45 | 6.73 | 0.00 | 0.31 | 0.40 | 10.5 | 0.15 | 0.21 | 12.1 | 1.03 | |
| Amaranthus retroflexus | 0.62 | 0.70 | 8.11 | 0.10 | 0.12 | 0.19 | 78.8 | 0.00 | 15.4 | 22.7 | 3.70 | 23.7 | 0.05 | |
| Amaranthus blitoides | 2.18 | 26.36 | 0.00 | 0.06 | 0.00 | 0.00 | 0.44 | 8.44 | 0.00 | 0.15 | 0.00 | 0.28 | 0.00 | |
| Portulaca oleracea | 0.00 | 0.00 | 17.46 | 0.95 | 0.00 | 0.00 | 5.34 | 31.97 | 28.7 | 0.50 | 0.00 | 0.00 | 0.00 | |
| Setaria viridis | 4.50 | 4.12 | 31.09 | 0.00 | 7.36 | 0.00 | 20.85 | 19.18 | 3.41 | 0.00 | 0.03 | 2.61 | 0.00 | |
| 2006-2007 | ||||||||||||||
| Convulvulus arvensis | 5.59 | 5.59 | 0.47 | 4.44 | 4.46 | 0.78 | 21.12 | 7.12 | 13.68 | 1.27 | 13.96 | 3.26 | 1.71 | |
| Sonchus arvensis | 1.77 | 1.60 | 5.88 | 0.00 | 0.32 | 9.07 | 0.00 | 1.17 | 0.00 | 3.94 | 0.00 | 0.13 | 0.00 | |
| Cyperus rotundus | 78.72 | 26.39 | 31.14 | 21.46 | 59.61 | 33.84 | 62.28 | 40.11 | 41.89 | 26.04 | 73.43 | 8.09 | 10.45 | |
| Echinocloa crus-galli | 210.34 | 53.81 | 40.57 | 48.19 | 13.02 | 258.69 | 147.02 | 79.39 | 72.42 | 83.75 | 129.96 | 20.61 | 55.07 | |
| Digitaria sp. | 35.24 | 22.04 | 156.20 | 12.35 | 59.37 | 64.79 | 113.51 | 72.46 | 43.40 | 13.49 | 11.00 | 58.08 | 29.11 | |
| Solanum nigrum | 1.03 | 2.14 | 7.28 | 8.49 | 6.38 | 5.74 | 0.04 | 20.14 | 7.76 | 11.39 | 0.84 | 2.63 | 5.86 | |
| Amaranthus retroflexus | 0.00 | 0.00 | 0.00 | 0.00 | 1.22 | 14.16 | 9.87 | 0.00 | 0.00 | 0.83 | 0.00 | 3.59 | 0.38 | |
| Amaranthus blitoides | 0.00 | 0.16 | 0.00 | 11.86 | 2.03 | 2.27 | 8.67 | 0.00 | 3.50 | 0.02 | 1.65 | 4.78 | 0.09 | |
| Portulaca oleracea | 0.00 | 0.00 | 0.14 | 10.48 | 4.06 | 6.05 | 2.56 | 0.00 | 7.10 | 0.21 | 0.11 | 0.42 | 0.00 | |
| Setaria viridis | 6.38 | 0.00 | 0.00 | 0.00 | 2.56 | 0.00 | 0.00 | 0.00 | 0.01 | 0.00 | 0.00 | 7.40 | 0.00 | |
| LSD(first growing season)=20.06 LSD( second growing season)=15.84 | ||||||||||||||
pan (common millet) ،pen (Pearl millet) ، set (Foxtail millet), soyw ( soybean,Wiliams variety) soys (soybean, Sahar variety), soyg (soybean, Gorgan3 variety), se (sesame), tri (Fenugreek) ،tra (Ajowan), pps (intercropping of 3 Millet species), sss (intercropping of 3 soybean varieties), pss (intercropping of Millet, Sesame, Fenugreek)، pstt (intercropping of Millet, Sesame, Fenugreek, Ajowan)
Table 4. Total density of important weed species (plant.m-2) in different cropping systems during 2005-2006 and 2006-2007.
| 2005-2006 | |||||||||||||||
| species | pan | pen | set | soyw | soys | soyg | se | tri | tra | pps | sss | pss | pstt | ||
| Convulvulus arvensis | 1.56 | 0.00 | 1.56 | 3.12 | 1.56 | 4.68 | 6.00 | 9.37 | 4.68 | 4.68 | 1.56 | 1.56 | 7.81 | ||
| Sonchus arvensis | 0.00 | 16.86 | 0.00 | 0.00 | 0.00 | 0.00 | 4.10 | 3.12 | 1.56 | 0.00 | 0.00 | 1.04 | 0.00 | ||
| Cyperus rotundus | 48.43 | 0.00 | 39.06 | 92.18 | 0.00 | 8.33 | 10.93 | 35.93 | 4.68 | 0.00 | 6.25 | 3.12 | 12.50 | ||
| Echinocloa crus-galli | 18.75 | 16.06 | 13.54 | 18.23 | 10.93 | 6.25 | 6.25 | 20.31 | 32.50 | 12.50 | 9.06 | 12.50 | 10.03 | ||
| Digitaria sp. | 6.25 | 91.08 | 12.50 | 20.31 | 10.93 | 21.87 | 28.12 | 14.06 | 20.31 | 32.81 | 25.00 | 12.50 | 18.75 | ||
| Solanum nigrum | 1.56 | 3.65 | 3.12 | 2.60 | 1.56 | 0.00 | 1.56 | 3.12 | 8.33 | 1.56 | 1.56 | 3.12 | 1.56 | ||
| Amaranthus retroflexus | 1.56 | 0.70 | 1.56 | 1.56 | 1.56 | 1.56 | 3.93 | 0.00 | 2.60 | 1.56 | 4.68 | 3.12 | 1.56 | ||
| Amaranthus blitoides | 1.56 | 26.36 | 0.00 | 1.56 | 0.00 | 0.00 | 1.56 | 1.56 | 0.00 | 1.56 | 0.00 | 1.56 | 0.00 | ||
| Portulaca oleracea | 0.00 | 0.00 | 3.12 | 4.68 | 0.00 | 0.00 | 14.06 | 6.25 | 4.68 | 4.68 | 0.00 | 0.00 | 0.00 | ||
| Setaria viridis | 3.12 | 4.12 | 4.68 | 0.00 | 3.12 | 0.00 | 10.81 | 6.25 | 4.68 | 0.00 | 1.56 | 1.56 | 0.00 | ||
| 2006-2007 | |||||||||||||||
| Convulvulus arvensis | 10.00 | 10.00 | 2.00 | 3.12 | 5.33 | 2.00 | 12.00 | 8.00 | 6.00 | 5.33 | 16.00 | 6.00 | 2.00 | ||
| Sonchus arvensis | 2.00 | 4.00 | 14.00 | 0.00 | 2.66 | 24 | 0.00 | 2.00 | 0.00 | 2.00 | 0.00 | 1.33 | 1.33 | ||
| Cyperus rotundus | 70.00 | 16.00 | 46.00 | 88.00 | 15.00 | 72.00 | 80.00 | 38.00 | 60.00 | 16.00 | 86.00 | 28.00 | 38.00 | ||
| Echinocloa crus-galli | 26.00 | 26.00 | 26.00 | 16.00 | 11.33 | 30.00 | 26.00 | 28.00 | 22.00 | 24.00 | 36.00 | 13.66 | 22.00 | ||
| Digitaria sp. | 10.00 | 18.50 | 48.00 | 12.41 | 14.00 | 12.00 | 23.50 | 26.00 | 18.00 | 13.08 | 6.00 | 32.00 | 26.00 | ||
| Solanum nigrum | 4.00 | 4.00 | 8.00 | 8.00 | 12.00 | 2.00 | 2.00 | 14.00 | 10.00 | 26.00 | 4.00 | 8.00 | 24.00 | ||
| Amaranthus retroflexus | 0.00 | 0.00 | 0.00 | 0.00 | 2.00 | 4.66 | 2.00 | 0.00 | 0.00 | 4.00 | 0.00 | 4.00 | 2.00 | ||
| Amaranthus blitoides | 0.00 | 2.00 | 0.00 | 7.33 | 2.00 | 2.00 | 8.00 | 66/2 | 2.00 | 2.00 | 2.00 | 4.00 | 2.00 | ||
| Portulaca oleracea | 0.00 | 0.00 | 6.00 | 6.00 | 4.00 | 4.00 | 4.00 | 0.00 | 6.66 | 6.00 | 2.00 | 6.00 | 0.00 | ||
| Setaria viridis | 6.00 | 0.00 | 0.00 | 0.00 | 2.00 | 0.00 | 0.00 | 0.00 | 4.00 | 0.00 | 0.00 | 6.00 | 0.00 | ||
| LSD(first growing season)=20.06 LSD( second growing season)=15.84 | |||||||||||||||
pan (common millet) ، pen (Pearl millet) ، set (Foxtail millet), soyw ( soybean,Wiliams variety) ،soys (soybean, Sahar variety), soyg (soybean, Gorgan3 variety), se (sesame), tri (Fenugreek) ، tra (Ajowan), pps (intercropping of 3 Millet species), sss (intercropping of 3 soybean varieties), pss (intercropping of Millet, Sesame, Fenugreek)، pstt (intercropping of Millet, Sesame, Fenugreek, Ajowan)
Table 5. Weed density and total dry matter in manure and chemical treatments.
| Organic fertilizer | Inorganic fertilizer | |
| Weed dry weight | 127.28b* | 300.22a |
| Weed density | 84.92b | 98.56a |
Means with the similar letters in each column are not significantly different at p≤0.05.
The composition of crop species affected weed dry weight significantly. With increasing crop diversity, total dry weight of weeds decreased and crop mixtures had the lowest dry weight of weeds. Also crop species affected weed dry weight in monocultures, as the lowest weed dry weight was observed in common millet, soybean (Sahar and Gorgan3 Varieties) in first growing season and Pearl millet, sesame and fenugreek in second year (Fig. 1 and 2). Ball (7) demonstrated that crop species is the most important factor on species composition of weed seed bank. Continues cultivation of crop species and agricultural operations decreased weed diversity and dominant species compared to intercropping systems.
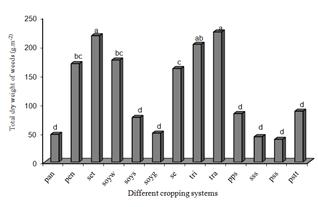
Fig. 1. Weed dry weight in different cropping systems during 2005-2006.
Means with the similar letters are not significantly different at p≤0.05
As it is shown in figures 3 and 4, the kind of cropping pattern affected total weed density significantly. In first growing season, the lowest weed density was obtained in cropping pattern based on functional diversity including millet, soybean and sesame (9.38 plants per square meter). The highest weed density was observed in soybean (Williams’s variety) monoculture. In second growing season, the highest weed density was in foxtail millet monoculture.
In general, cropping pattern based on genetic, species and functional diversity had the lowest weed dry weight and density compared to others. Weed biomass and frequency difference in intercropping was due to complementary state for nutrient absorption by crops, dynamic and variation of vegetation during growth season. Poggio (20), with evaluation weed community structure in monoculture and additive intercropping of barley and pea found that with increasing plant biomass, weeds were suppressed. It seems that forage and allelopathic crops in intercropping systems decrease weeds.
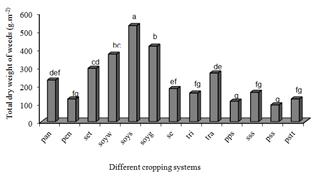
Fig. 2. Weed dry weight in different cropping systems during 2006-2007.
Means with the similar letters are not significantly different at p≤0.05
pan (common millet) ، pen (Pearl millet) ، set (Foxtail millet), soyw ( soybean,Wiliams variety)، soys (soybean, Sahar variety), soyg (soybean, Gorgan3 variety), se (sesame), tri (Fenugreek) ،tra (Ajowan), pps (intercropping of 3 Millet species), sss (intercropping of 3 soybean varieties), pss (intercropping of Millet, Sesame, Fenugreek)، pstt (intercropping of Millet, Sesame, Fenugreek, Ajowan)
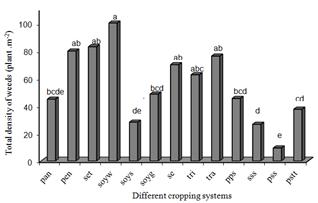
Fig. 3. Weed density in different cropping systems during 2005-2006.
Means with the similar letters are not significantly different at p≤0.05
pan (common millet) ، pen (Pearl millet) ، set (Foxtail millet), soyw ( soybean,Wiliams variety) ، soys (soybean, Sahar variety), soyg (soybean, Gorgan3 variety), se (sesame), tri (Fenugreek) ،tra (Ajowan), pps (intercropping of 3 Millet species), sss (intercropping of 3 soybean varieties), pss (intercropping of Millet, Sesame, Fenugreek)، pstt (intercropping of Millet, Sesame, Fenugreek, Ajowan).
There was a significant regression between crop Shannon index and weed Shannon index, in two growing seasons. With increasing diversity and physiological and morphological differences in adjacent crops, weed diversity decreased (fig. 5 and 6). Results indicated that range of weed Shannon index was the same in two years, but crop Shannon index was increased in second growing season rather than first growing season. A reason for this result was better crop establishment in second growing season.
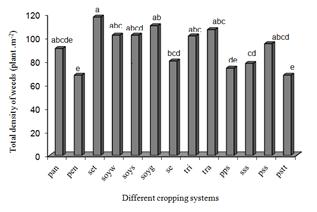
Fig. 4. Weed density in different cropping systems during 2006-2007.
Means with the similar letters are not significantly different at p≤0.05
pan (common millet) ، pen (Pearl millet) ، set (Foxtail millet), soyw ( soybean,Wiliams variety) ، soys (soybean, Sahar variety), soyg (soybean, Gorgan3 variety), se (sesame), tri (Fenugreek) ،tra (Ajowan), pps (intercropping of 3 Millet species), sss (intercropping of 3 soybean varieties), pss (intercropping of Millet, Sesame, Fenugreek)، pstt (intercropping of Millet, Sesame, Fenugreek, Ajowan)
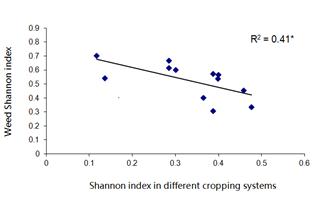
Fig. 5. Regression between crop and weed Shannon index during 2005-2006.
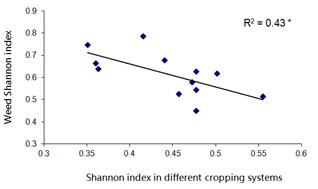
Fig. 6. Regression between crop and weed Shannon index during 2006-2007.
There was a negative regression between crop and weed Margalof indices during two growing seasons so that with increasing crop Margalof index, weed Margalof index decreased significantly (Fig. 7 and 8).
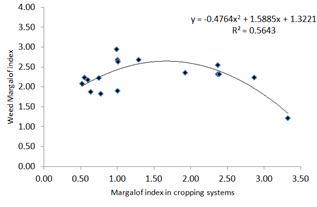
Fig. 7. Regression between crop and weed Shannon index during 2005-2006.
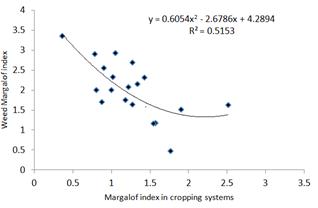
Fig. 8. Regression between crop and weed Shannon index during 2006-2007.
With increasing crop diversity and increasing competition between crop and weeds species, resources use efficiency were improved and weed diversity was decreased. It is mentioned that crop diversity index was calculated based on finally species density and these densities were lower than their first densities at the time of cultivation. Poggio (20) demonstrated that by intercropping of barley and pea, weed species diversity was decreased because of better light absorption by crops canopy because in this state, less light was received by lower layers and was induced secondary dormancy (6, 20). Baumann et al. (12) reported that intercropping of leek and celery improved light absorption and suppressed weeds. Barberi et al. (9) demonstrated that crop agricultural cultivation including incorrect crop rotations and monocultures, are important factors for increasing weeds. The most important determining factor affected weed composition and diversity is difference in agricultural managment methods (ferilizer, pesticide and herbicide) (31).
The average of Shannon and Margalof index for weed diversity was changed by different cropping systems significantly. In first growing season, the highest weed diversity was observed in sesame (0.75) and ajowan (0.72) monocultures. The lowest weed Shannon index was obtained in diverse cropping systems that had not significant difference, statistically. In second growing season, the highest weed Shannon index was in soybean (sahar- variety) monoculture (0.72) and intercropping of three millet species (0.71). The lowest weed Margalof and Shannon index was obtained in intercropping of millet, fenugreek, ajowan and sesame, in two growing season (table 6).
Effect of nutrient resource on weed and crop diversity was not significant statistically. Weed and crop diversity under organic fertilizer was more than inorganic conditions (table7).
Table 6. Effect of different cropping systems on crop and weed Shannon and Margalof index during 2005-2006 and 2006-2007.
| 2005-2006 | 2006-2007 | |||||||
| Cropping systems | Margalof index | Shannon index | Margalof index | Shannon index | ||||
| weed | Crop | weed | Crop | weed | Crop | weed | Crop | |
| pan | 2.06abc | 0.00c | 2.06abc | 0.00c | 1.92cd | 0.00d | 0.54cd | 0.00c |
| pen | 2.31abc | 0.00c | 2.31abc | 0.00c | 2.50bc | 0.00d | 0.65abc | 0.00c |
| set | 1.92abc | 0.00c | 1.92abc | 0.00c | 2.00cd | 0.00d | 0.60abcd | 0.00c |
| soyw | 1.66c | 0.00c | 1.66c | 0.00c | 2.13cd | 0.00d | 0.46d | 0.00c |
| soys | 2.71a | 0.00c | 2.71a | 0.00c | 1.73cd | 0.00d | 0.72a | 0.00c |
| soyg | 1.91abc | 0.00c | 1.91abc | 0.00c | 1.71cd | 0.00d | 0.53cd | 0.00c |
| se | 2.09abc | 0.00c | 2.09abc | 0.00c | 3.40a | 0.00d | 0.56bcd | 0.00c |
| tri | 1.84bc | 0.00c | 1.84bc | 0.00c | 2.32cd | 0.00d | 0.58abcd | 0.00c |
| tra | 2.55ab | 0.00c | 2.55ab | 0.00c | 3.14ab | 0.00d | 0.67abc | 0.00c |
| pps | 2.57ab | 0.14b | 2.57ab | 0.14b | 2.08cd | 0.98bc | 0.71ab | 0.40b |
| sss | 1.96abc | 1.51a | 1.96abc | 1.51a | 1.77cd | 2.37a | 0.54cd | 0.48a |
| pss | 2.53ab | 0.90b | 2.53ab | 0.90b | 1.93cd | 0.84c | 0.65abc | 0.39b |
| pstt | 1.66c | 1.61a | 1.66c | 1.61a | 1.64d | 1.30b | 0.55cd | 0.50a |
Means with the similar letters in each column are not significantly different at p≤0.05
Table 7. Effect of nutrient resource on crop and weed Shannon and Margalof index during 2005-2006 and 2006-2007.
| Nutrient resource | 2005-2006 | 2006-2007 | ||||||
| Margalof index | Shannon index | Margalof index | Shannon index | |||||
| weed | Crop | weed | Crop | weed | Crop | weed | Crop | |
| Organic fertilizer | 2.20a | 0.41a | 0.56a | 0.11a | 2.36a | 0.42a | 0.40a | 0.14a |
| Inorganic fertilizer | 2.10a | 0.37a | 0.50a | 0.09a | 1.99a | 0.42a | 0.60a | 0.13a |
Means with the similar letters in each column are not significantly different at p≤0.05
The means of weed Shannon and Margalof indices were changed with altering cropping systems. In the first year, with increasing physiological and morphological characteristics of crops, Shannon index for weed diversity decreased but, Shannon index hadn’t constant trend in the second year. The highest of Shannon index was observed in cropping systems based on variety diversity, in the second year (0.7) (Fig. 9). Also in the first growing season, the highest weed Margalof index was observed in monoculture. In the second growing season, species diversity had the highest weed Margalof index (Fig. 10).
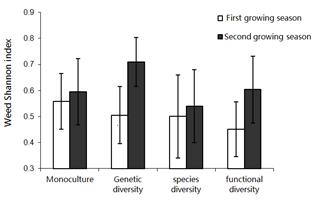
Fig. 9. The means of weed Shannon index in kinds of crop diversity.
Mohler, and Liebman (19) demonstrated that intercropping of barley and pea and barley monoculture were similar in weed species richness approximately. However, weed species richness in pea was the most (17, 19). Poggio et al, (21) investigated weed community in pea and wheat in Argentina.
They found that weed community in pea field was divers rather than weed field. A reason for this result was difference in fertilizer, herbicide and pesticide management and previous product.
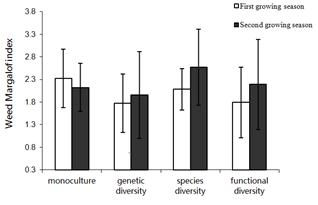
Fig. 10. The means of weed Margal of index in kinds of crop diversity.
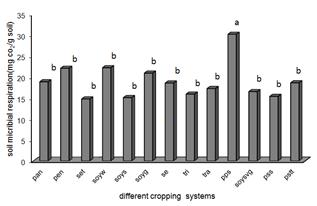
Fig. 11. The effect of different cropping systems on soil microbial respiration.
Effect of different cropping systems was significant on soil microbial respiration. The highest soil microbial respiration amount was obtained in three millet intercropping and there was not significant difference for others (Fig. 11).
With crop diversity, soil microbial respiration increased and positive significant regression between crop Shannon index and soil microbial respiration was observed (Fig. 12). Positive significant regression between crop Margal of index and soil microbial respiration (R2=0.55) was obtained, also (Fig. 13.). With increasing diversity on the ground, microorganisms’ activity was improved.
Lin et al. (16) studied the effects of six planting patterns of peanut, i.e., spring sowing and plastic film mulching, spring sowing and open cultivation, summer sowing and plastic film mulching, summer sowing and open cultivation, intercropped in wheat field, intercropped in wheat field and plastic film mulching on soil microbial biomass c and respiration founded that intercropped in wheat field and plastic film mulching increased soil microbial biomass C, active microbial biomass, and respiration rate.
Zhang et al. (32) investigated the effects of maize-peanut intercropping, maize monoculture and peanut monoculture on the rhizosphere soil microbial community and nutrient contents. Comparing with monoculture, intercropping could significantly increase the quantity of soil bacteria in both maize and peanut root areas. The functional diversity and metabolic activity of soil microbial community also improved under intercropping.
Generally, weed abundance, their portions for nutrient absorption and chemical herbicides application can be decreased with correct crop rotation in monocultures and increasing crop diversity.
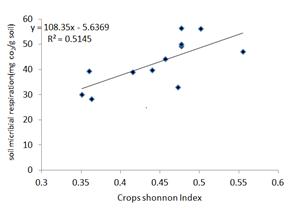
Fig. 12. Regression between crop Shannon index and soil microbial respiration.
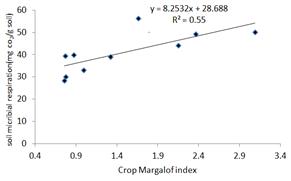
Fig. 13. Regression between crop Marhalof index and soil microbial respiration.
4. Conclusion
Integrating native knowledge and modern agriculture can help stability and sustainability in agricultural production and food security.
Increasing crop diversity, ecological niches and gaps were occupied by benefit species and weeds had not opportunity to appear in agroecosytem. According to these results, continuity of current systems based on external input application and decreased species diversity affected ecosystem function and weed management (5, 18).
References
- Altieri, M. A. 1999. The ecological role of biodiversity in agroecosystems. Agriculture, Ecosystems and Environment. 74:19-31.
- Andersson, T. N, and P. Milberg. 1998. Weed flora and the relative importance of site, crop, crop rotation and nitrogen. Weed Science. 46:30-38.
- Ball, D. A. 1992. Weed seedbank respons to tillage, herbicide and crop rotation sequence. Weed Science. 40: 654-656.
- Banks, P. A., P. W. Santelman, and B. B. Tucker. 1976. Influence of long-term soil fertility treatments on weed species in winter weed. Agronomy Journal. 68:825-827.
- Barberi, P., N. Silvestri, and E. Bonari.1997. Weed communities of winter wheat as influenced by input level and rotation. Weed Research. 37: 301-313.
- Baumann, D. T., L. Bastiaans, and M. J. Kropff. 2001. Effects of intercropping on growth and reproductive capacity of late- emerging Senecio vulgaris L., with spatial reference to competition for light. Annals of Botany. 87:209-217.
- Baumann, D. T., L. Bastiaans, J. Goudriaan, H. H. van Laar, and M. J. Krop.2002. Analyzing crop yield and plant quality in an intercropping system using an eco-physiological model for interplant competition. Agricultural Systems. 73: 173–203.
- Baumann, D. T., M. J. Kropff, and L. Bastiaans. 2000. Intercropping leeks to suppress weeds. Weed Research. 40:359-374.
- De Haan, R. L., D. L. Wyse, N. J. Ehlke, B. D. Maxwell, and D. H. Putnam. 1993. Simulation of spring-seeded smother plants for weed control in corn (Zea mays). Weed Science. 42: 35-43.
- Hafman, M. L., E. E. Regnier, and J. Cardina. 1993. Weed and corn (Zea mays) response to a hairy vetch (Vicia villosa) cover crop. Weed Technology. 7: 594-599.
- Kegod, G. O., F. Forcella, and S. Caly. 1999. Influence of crop rotation, tillage, and management inputs on weed seed production. Weed Science. 47:175-183. 326p.
- Kennedy, A.c., T.L.Stubbs, and W.f. Schillinger.2004. Soil and Crop Management Effects on Soil Microbiology. CRC Press.
- Koocheki, A., M. Nassiri- mahallati and A. Zare-feiz abadi. 2004. Agricultural biodiversity in Iran: crop varieties diversity. Desert. 9: 49-67. b
- Koocheki, A., M. Nassiri- mahallati and M. Jahanbin. 2004. Agricultural biodiversity in Iran: agroecosystem diversity. Pajuhesh va Sazandegi. 10: 70-83.a
- Koocheki, A., M. Nassiri- mahallati, L. Tabrizi, G. Azizi, and M. Jahan. 2006.Assessing species and functional diversity and community structure for weeds in wheat and sugar beet in Iran, Agricultural researches of Iran, 4: 105-129.
- Lin, Y.J., F. Gao, J.L. Zhang, L.Y. Zhou, X.M. Zhang, B.L. Li, H.J. Zhao, and X.D. Li. 2010.Soil microbial biomass and respiration rate under effects of different planting patterns of peanut.Chinese Journal of Applied Ecology. 21: 2323-2328.
- Mahn, E. G. 1984. Structural changes of weed communities and population. Vegetation. 58:79-85.
- Marshall, E. J. P., V. K. Brown, N. D. Boatman, P. J. W. Lutman ,G. R. Squire and L. K. Ward. 2003. The role of weeds supporting biological diversity within crop fields. Weed Research. 43: 77-89.
- Mclaughlin A., and P. Minrau. 1995. The impact of agricultural practices on biodiversity.Agriculture, Ecosystems and Environment. 55:201-212.
- Mohler, C. L., and M. Liebman. 1987. Weed productivity and composition in soil crops and intercrops of barley and field pea. Journal of Applied Ecology. 24:685-699.14
- Nassiri- mahallati, M., Koocheki, A., P. Rezvani- Moghadam and A. Beheshti. 2001. Agroecology. Ferdowsi University of Mashhad Publication.
- Poggio, S. L. 2005. Structure of weedcommunities occurring in monoculture and intercropping of field pea and barley. Agriculture, Ecosystems and Environment. 109: 48-58.
- Poggio, S. L., E. H. Satorre and E. B. de la Fuente.2004.Structure of weed communities occurring in pea and wheat crops in the Rolling Pampa (Argantina). Agriculture, Ecosystems and Environment. 103:225-235.
- RenneJ. I., J. Gerrish, and M. A. Sanderson. 2004. Effects of plant diversityon invasion ofweedspecies in experimental pasture communities.Basic and Applied Ecology. 5:543-550.
- Salas, M. L., M. V. Hickman, D. M. Huber, and M. M. Schreiber. 1997. Influence of nitrate and ammonium nutrition on the growth of giant foxtail (Setaria faberi). Weed Science. 45: 664 - 669.
- Schreiber, M. M. 1992. Influence of tillage, crop rotation and weed management on giant foxtail (Setaria faberi) population dynamics and crop yield. Weed Science. 40: 645-653.
- Tengberg, A., J. Ellis-Jones, R. Kiome and M. Stocking. 1998. Applying the concept of agrodiversity to indigenous soil and water conservation practices in eastern Kenia. Agriculture, Ecosystems and Environment. 70:259-272.
- Vandermeer, J., M. Van Noordwijk, J. Anderson, C. Ong, and I. Perfecto. 1998. Global change and multi-species agroecosystems: concepts and issues. Agriculture, Ecosystems and Environment. 67: 1-22.
- Xu, H., R, Xiao, T. Song, W. Luo, Q. Ren, and Y. Huang. 2008. Biodiversity science. 16: 166-174.
- Yang, R. J., H.L., Ma, Q.F. Yang and Jun.Y. Niu. 2007. Effects of planting density and nitrogen application rate on soil microbial activity under wheat/forage rape multiple cropping. The journal of applied ecology. 18:113-117.
- Yin L., Z. Cai, and W. Zhong. 2006. Changes in weed community diversity of maize crops due to long-term fertilization . Crop Protection. 25:910-914.
- Zhang, J.E., A.X. Gao, H.Q. Xu, and M.Z. Luo. 2009. Effects or maize/peanut intercropping on rhizosphere soilmicrobes and nutrient contents. The journal of applied ecology. 20: 1597-1602.


