
Agricultural and Biological Sciences Journal, Vol. 1, No. 5, October 2015 Publish Date: Jul. 9, 2015 Pages: 190-196
Hepatotoxic Effect of Aflatoxin-Contaminated Agro Feeds (Groundnut, Maize & Melon Seed) on Wistar Albino Rats
Onyegeme-Okerenta Blessing M.*, Enyadike Nelson U.
Department of Biochemistry, Faculty of Chemical Sciences, College of Natural and Applied Sciences, University of Port Harcourt, Choba, Rivers State, Nigeria
Abstract
The present study is an attempt to evaluate the hepatotoxicity of aflatoxin-contaminated feed on Wister albino rats. Thirty-six experimental albino rats were grouped into four (4); the control group (CT) was fed with uncontaminated commercial feed, group AG was fed with aflatoxin-contaminated groundnut, group BM was fed with aflatoxin-contaminated maize grain and group CM was fed with aflatoxin-contaminated melon seed. The aflatoxin concentrations of the various feeds were measured using Enzyme linked Immunosorbent Assay (ELISA) method. The rats were fed for a period of 21 days while three rats from each group were sacrificed weekly to study various liver enzyme activities - gamma glutamyl transferase [GGT], aspartate amino transferase [AST], alanine amino transferase [ALT] and lactate dehydrogenase [LDH]). Results of AST activity showed that AG (52.00±1.00U/L), BM (30.00±1.00U/L) and CM (46.66±0.57U/L) were significantly higher (p<0.05) when compared to CT (26.33 ± 0.57 U/L) after week 1 of feeding the rats. Similarly GGT, LDH, and ALT activities of groups fed with aflatoxin-contaminated feeds after weeks 1, 2 and 3 were significantly higher (p<0.05) when compared to control group. The results reveal that the aflatoxin present in the groups fed with aflatoxin–contaminated feeds is responsible for the increased enzyme activities observed. Histopathological analysis of photomicrographs showed varying degrees of hepatotoxicity of AG, BM and CM when compared to control group.
Keywords
Aflatoxin, Hepatotoxicity, Contaminated Agro Feeds, Liver Enzyme Activity, Hepatocytes
Received: May 23, 2015
Accepted: June 10, 2015
Published online: July 7, 2015
@ 2015 The Authors. Published by American Institute of Science. This Open Access article is under the CC BY-NC license. http://creativecommons.org/licenses/by-nc/4.0/
Contents
1. Introduction 2. Methods 2.1. Collection and Preparation of Animal 2.2. Grouping of Animals 2.3. Preparation of Aflatoxin-Contaminated Feed 2.4. Test for Aflatoxins and Biochemical Indices 2.5. Inducing Aflatoxicosis in Animals 2.6. Collection of Blood Samples 2.7. Statistical Analysis 3. Results 3.1. Weight of Animals 3.2. Week 1 3.3. Week 2 3.4. Week 3 4. Discussion and Conclusion Acknowledgement
1. Introduction
One major problem of the world today is that regarding diseases. Some of these diseases are caused by contamination of our food which can basically happen anytime during the food production or storage. A major source of this contamination is from fungal activities which produce aflatoxins. Aflatoxins are naturally occurring mycotoxins produced by the fungi species Aspergillus flavus and Aspergillus parasiticus. They are toxic secondary metabolites of A. parasiticus and A. flavus. Among mycotoxins, aflatoxins are the most hepatotoxic; they are well-known carcinogens especially aflatoxin B1 (AFB1) to humans and animals. There are about 20 aflatoxins-related fungal metabolites produced. The World Health Organization (WHO) for cancer research institutions designated aflatoxins as Class 1 carcinogens. Not only are aflatoxins hepatotoxic and carcinogenic, they are also immunosuppressive, teratogenic, mutagenic and nephrotoxic (Strosnider et al., 2006; Dhanasekaran 2011; Mushtaq et al., 2012).
Aflatoxin is found in soil, plants and animals, all kinds of nuts, especially peanuts and walnuts. It is also found in soybean, rice, maize, pasta, condiments, milk, dairy products and edible oil products. Aflatoxin often occur in crops in the field prior to harvest. Post-harvest contamination can occur if crop drying is delayed and during storage of the crop if water is allowed to exceed critical values for the mould growth. Insect or rodent infestations facilitate mould invasion of some stored commodities (Fouzia & Samajpati, 2000).
Countries such as Nigeria that is located between 40ºN and 40ºS latitude, a tropical climate, offer suitable growing conditions for the fungi. The staple food in Nigeria includes grains and cereals; proper harvesting practice and good storage facilities of these grains and cereals are of utmost importance. Among staple cereals in the Nigerian diet, maize has the highest levels of aflatoxin contamination (Bandyopadhyay et al., 2007). There is also evidence of high levels of contamination in Nigerian groundnuts. Over the past 5 years, there were 12 published studies assessing aflatoxin prevalence in Nigeria (7 assessing aflatoxin prevalence in maize and 5 assessing prevalence in groundnuts). The evidence does suggest that aflatoxins contamination in Nigeria warrants attention (Abt Associates, 2012).
The economic and country assessment conducted in 2012 by Abt Associates in collaboration with representatives of the Mycotoxicology Society of Nigeria (MYCOTOXSON) and Nigeria’s National Agency for Food and Drug Administration and Control (NAFDAC) concluded that the largest impact of aflatoxin in Nigeria is on health, especially human. The assessment found little awareness about aflatoxin among farmers, rural traders, and consumers. Despite aflatoxin standards, unpackaged food and found bound for domestic consumption are not regulated. This means that aflatoxin-contaminated grain can easily enter the Nigerian consumption stream (Abt Associates, 2012; Adejomo and Orole, 2015). The Standards Organization of Nigeria (SON) sets standards on many food commodities, taking into account global standards as well as national production and target export markets. The level of contamination of aflatoxin is measured in parts per billion (ppb) or micrograms per kilogram (µg/kg) (SON, 2003). While it is generally recognized globally that there is no safe level of aflatoxin exposure, SON has set the maximum acceptable limit: maize grain at 4 ppb for total aflatoxins and 2 ppb for aflatoxin B1(SON, 2003); groundnut seed 20 ppb (SON, 2006); groundnut cake snack known as kulikuli 4 ppb and an aflatoxin B1 <2ppb (SON, 2008).
Aflatoxin thrives more in tropical climatic conditions hence the need to better equip one's self with possible knowledge of the toxin; how it gets into the food stuff? What level of intake can cause harm and how does the body react to the toxin? This study attempts to investigate the level of aflatoxicosis especially as it affects the liver which is the organ of metabolism of ingested food stuff. It aims at establishing if there is any correlation between the lengths of exposure of the toxin to the level of damage done on the liver.
2. Methods
2.1. Collection and Preparation of Animal
Thirty-six Wister albino rats bought from the University of Port Harcourt Animal House Choba, were kept in the animal cages throughout the course of the research work. There was no need for acclimatization as there was no change of environment.
2.2. Grouping of Animals
The animals were grouped into four of nine (9) rats each. Each group was fed daily with 180g of the individual feeds. Group CT (Control Group) was fed with grower mash feed (Top feeds Ltd), group AG fed with aflatoxin-contaminated groundnut, group BM fed with aflatoxin-contaminated maize and group CM fed with aflatoxin-contaminated melon seed daily.
2.3. Preparation of Aflatoxin-Contaminated Feed
The feeds (grower mash, maize grain, groundnut and melon seed) were bought from Choba market. Maize grain, groundnut and melon seed were grinded using the regular electromechanical grinding machine and stored in air-tight containers and tested for level of aflatoxin. Five grams of each of the agro samples (maize, groundnut and melon seed) were weighed into different conical flasks and a 15ml aliquot of 0.1% of Tween 20 was introduced into each flask. The flasks were placed on orbital shaker set at 250 rotations for 270secs. The content of each flask was filtered into a test tube using folded filter paper and kept for further analysis.
2.4. Test for Aflatoxins and Biochemical Indices
Test for aflatoxins was carried out using the ELISA Reader method for aflatoxins as described by Ayejuyo et al. (2011). Test for biochemical indices (Gamma Glutamyl Transferase [GGT], Aspartate Amino transferase [AST], alanine amino transferase [ALT] and lactate dehydrogenase [LDH]) were analyzed by kinetic methods kits from Randox, (United Kingdom) using a double-beam spectrophotometer.
2.5. Inducing Aflatoxicosis in Animals
After the initial concentration of aflatoxin was determined in the various feeds, the animals in groups AG, BM and CM were fed with groundnut, maize and melon seed respectively while the control group (CT) was fed with grower mash feed (Top feed Ltd).
2.6. Collection of Blood Samples
The investigation lasted for 3 weeks and three rats from each group were sacrificed per week. The animals to be sacrificed were first anaesthetized with chloroform (inhalational anesthesia) followed by cervical dislocation. Each animal was then placed on a dissecting slab and then cut along the thorax down the abdominal region; blood was collected via cardiac puncture and dispense into the Heparin bottle for biochemical assays (GGT, AST, ALT and LDH) while the liver tissues were fixed in 10% formal saline fixative in a plain bottle for three days for histological studies. The tissues were subjected to standard routine histological procedures as described by Brown (2002). The slides were viewed using the light microscope and histopathological changes were observed and recorded at X40 magnification identifying both the normal and the degenerated hepatocytes.
2.7. Statistical Analysis
Data was expressed as mean ± standard error of mean (SEM) for three repeated determination. One way ANOVA, performed with the Origin software (version 7.0), was used for statistical analysis between groups. Differences were considered significant at p<0.05.
3. Results
3.1. Weight of Animals
Baseline or initial average weights of rats obtained in all the groups are as follow: Control group (CT) 112.7g, group fed with aflatoxin-contaminated groundnut (AG) 143.22g, group fed with aflatoxin-contaminated maize (BM) 125.94g and group fed with aflatoxin-contaminated melon seed (CM) 120.14g. When the initial weights of the animals in all groups were compared to the weights of the animals after weeks 1, 2 and 3 of feeding, there was a significant increase in average weight of the animals as well as their liver weight (p<0.05) in the CT (control group) compared to the groups fed with aflatoxin–contaminated feeds. A significant reduction in average weight of the animals was observed in groups fed with maize, melon seed and groundnut after weeks 2 and 3 (Tables 2 and 3). However, there was a significant increase in average liver weight of all the groups fed with aflatoxin-contaminated feeds. Considering the fact that the animals were fed ad libitum, it can be said that the presence of aflatoxin in feeds of these animals caused a significant reduction in the weights of groups AG and CM.
Figure 1 shows aflatoxin concentration present in groundnut, maize and melon seed used as supplementary feeds for the experimental rats. It was observed that the level of aflatoxin present in groundnut seed was significantly higher (p<0.05) than that found in maize grain and that it exceeded SON (2003-2006) recommended maximum acceptable limits for groundnut. However, aflatoxin present in maize grain was within SON recommended maximum acceptable limit.
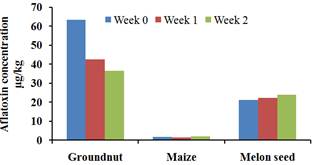
Fig. 1. Aflatoxin concentration (µg/kg) of selected feeds.
3.2. Week 1
Table 1 shows the initial average weights (baseline weights), average weights of rats and liver, activity of the enzymes observed when the control group were compared with groups fed with aflatoxin-contaminated feeds after week 1. When the baseline weights of the animals in all groups were compared with the weights of the animals after week 1, it was observed that the control group gained more weight than groups fed with aflatoxin-contaminated feeds. There was a significant increase (p<0.05) in the activity of GGT, ALT and AST in groups fed with aflatoxin-contaminated feeds when compared with the control group. However, there was a significant reduction (p<0.05) in the activity of LDH in groups fed with aflatoxin-contaminated feeds when compared with the control group.
3.3. Week 2
Table 2 shows the average weight of rats and liver, and activity of the enzymes recorded after week 2. Enzyme activities observed show that there was a significant increase (p<0.05) in the activity of GGT, ALT and AST in groups fed with aflatoxin-contaminated feeds when compared with control group. However, there was a significant reduction (p<0.05) in the activity of LDH in groups fed with aflatoxin-contaminated feeds when compared with control group.
3.4. Week 3
Table 3 shows the average weight of rats and liver, and activity of the enzymes recorded after week 3. Enzyme activities observed show that there was a significant increase (p<0.05) in the activity of GGT, ALT and AST in groups fed with aflatoxin-contaminated feeds when compared with the control group. However, there was a significant reduction (p<0.05) in the activity of LDH in groups fed with aflatoxin-contaminated feeds when compared with the control group.
The differences in enzyme activities observed in rats in experimental groups fed with aflatoxin-contaminated feeds reflect toxicosis due to the various concentrations of aflatoxins in the feed (Fig. 1). This trend was observed for week 2 (Table 2) and week 3 (Table 3) even when the aflatoxins concentration varied but the overall enzyme activity reflected the level of concentration of the aflatoxins in the various feeds.
Table 1. Effect of Aflatoxicosis on overall body weight, Liver weight, ALT, AST, LDH and GGT level after week 1.
| Group | Initial Av. body Wt (g) | Av. wt of rats (g) | Av. wt of liver (g) | LDH (U/L) | GGT (U/L) | AST (U/L) | ALT (U/L) |
| CT | 112.70 | 153.50 | 5.77 | 500.00± 0.6 | 27.9±0.85 | 26.33 ± 0.57 | 7.66±0.57 |
| AG | 143.22 | 148.50 | 5.44 | 269.66±1.52a | 33.06 ± 0.45a | 52.00±1.00a | 17.33±0.57a |
| BM | 125.94 | 126.00 | 5.28 | 303.00±0.3b | 30.46 ± 1.45b | 30.00±1.00b | 6.66±1.15b |
| CM | 120.14 | 96.70 | 3.99 | 302.33±1.2c | 32.73±1.20c | 46.66± 0.57c | 16.66±0.57c |
The values are Mean ± Standard Deviation of Triplicate Enzyme Assay.
Superscript a represents the significant difference (p<0.05) when CT was compared to AG.
Superscript b represents significant difference (p<0.05) when CT was compared to BM.
Superscript crepresents significant difference (p<0.05) when CT was compared to CM.
CT - Control Group; AG - Groundnut + aflatoxins; BM - Maize + aflatoxins; CM - Melon seed + aflatoxins.
Table 2. Effect of Aflatoxicosis on overall body weight, Liver weight, ALT, AST, LDH and GGT level after week 2.
| Group | Av. wt of rats (g) | Av. wt of liver (g) | LDH (U/L) | GGT (U/L) | AST (U/L) | ALT (U/L) |
| CT | 154.90 | 6.66 | 499.66 ± 1.52 | 24.33 ± 1.15 | 27.00±1.00 | 20.33±0.55 |
| AG | 152.60 | 6.17 | 235.66±0.57a | 32.66±1.52a | 40.33± 0.57a | 25.66 ±0.57a |
| BM | 119.40 | 5.36 | 268.00±2.00b | 31.33± 1.15b | 26.66± 0.57b | 19.66±1.15b |
| CM | 112.90 | 4.63 | 370.66±0.57c | 33.00±1.73c | 31.33±1.52c | 20.00±1.00c |
The values are Mean ± Standard Deviation of Triplicate Enzyme Assay.
Superscript a represents the significant difference (p<0.05) when CT was compared to AG.
Superscript b represents significant difference (p<0.05) when CT was compared to BM.
Superscript crepresents significant difference (p<0.05) when CT was compared to CM.
CT - Control Group; AG - Groundnut + aflatoxins; BM - Maize + aflatoxins; CM - Melon seed + aflatoxins.
Table 3. Effect of Aflatoxicosis on overall body weight, Liver weight, ALT, AST, LDH and GGT level after week 3.
| Group | Av. wt of rats (g) | Av. wt of liver (g) | LDH (U/L) | GGT (U/L) | AST (U/L) | ALT (U/L) |
| CT | 155.90 | 5.28 | 333.66± 3.51 | 23.33±2.08 | 13.33±0.57 | 16.33±0.57 |
| AG | 147.40 | 5.15 | 67.66±0.57a | 32.66±0.57a | 24.00±1.00a | 25.33±0.57a |
| BM | 118.30 | 5.61 | 132.66± 2.51b | 30.66±l.l5b | 15.33±1.15b | 20.00±1.00b |
| CM | 124.90 | 4.47 | 167.00±l.73c | 31.66±l.52c | 18.33±0.57c | 25.00±0.00c |
The values are Mean ± Standard Deviation of Triplicate Enzyme Assay
Superscript a represents the significant difference (p<0.05) when CT was compared to AG.
Superscript b represents significant difference (p<0.05) when CT was compared to BM.
Superscript crepresents significant difference (p<0.05) when CT was compared to CM.
CT - Control Group; AG - Groundnut + aflatoxins; BM - Maize + aflatoxins; CM - Melon seed + aflatoxins3.5. Photomicrograph of Hepatocytes
|
CT |
AG |
|
BM |
CM |
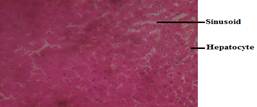
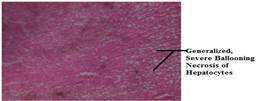
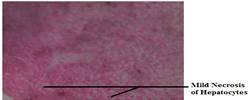
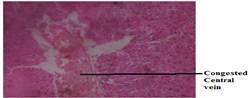
Fig. 2. Photomicrographs of the liver after week 1.
|
CT |
AG |
|
BM |
CM |
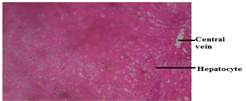
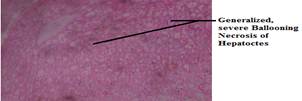
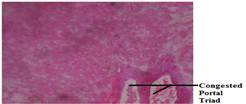
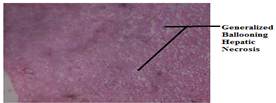
Fig. 3. Photomicrographs of the liver after week 2.
|
CT |
AG |
|
BM |
CM |
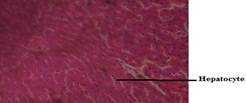
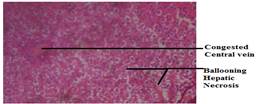
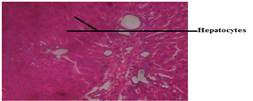

Fig. 4. Photomicrograph of the liver after week 3.
Figure 2 is the photomicrographs of all the groups after week 1. Photomicrograph of AG - the group fed with aflatoxin-contaminated groundnut showed generalized severe ballooning and necrosis of the hepatocytes when compared to photomicrographs of CT. This is due to the fact that AG had the highest concentration of aflatoxins when compared to the others. Photomicrographs of AG after weeks 1, 2 and 3 (Figures 2, 3 and 4 ) showed similar liver architecture. Photomicrographs of BM – the group fed with aflatoxin-contaminated maize - after weeks 1, 2 and 3, when compared to CT – the control group, showed mild necrosis of hepatocytes and congested portal triad while CM – the group fed with aflatoxin-contaminated melon seed - after weeks 1, 2 and 3 showed congested central vein and generalized ballooning with hepatic necrosis when compared with CT.
4. Discussion and Conclusion
Aflatoxin contamination in food is a serious global health problem, particularly in developing countries. Although it has been known for several decades that aflatoxins cause liver cancer in humans, the exact burden of aflatoxin-related hepatocellular carcinoma worldwide was unknown (Liu and Wu 2010). In this study, the effect of aflatoxin-contaminated feeds, most especially, on the average body weight and liver of rats was investigated. Aflatoxin concentrations present in the groundnut, maize and melon seed used as supplementary feeds for the experimental rats were higher than SON (2003-2006) recommended maximum acceptable limits. Aflatoxin affected body weight of the rats, it caused a decrease in the total body weight of the rats. The reduction in weight was observed more in the group that consumed feeds with higher concentration of aflatoxin. This result is in agreement with findings of Marin et al. (2002) who reported a dose related effect of aflatoxin upon body weight gain of piglets and that the reduction in weight gain may be attributed to the influence of aflatoxin. Similarly, Diaz et al. (2008) reported biphasic nature of effects of aflatoxin on weight gain in broiler, in which improvement at low doses and reduction in weight gain at high doses were observed. However, Yunus et al. (2011) reported that level and length of exposure determine the performance via percentage reduction in weight of broilers. They suggested that it is impracticable to generalize the dose response relationship with weight gain. On the other hand, there was an increase in the average weight of the liver of rats feed with aflatoxin-contaminated feeds. This is in agreement with Kubena et al. (1998) who reported a detrimental effect and an increase in liver weight of poultry exposed to aflatoxin.
The activity of serum or plasma enzymes has been extensively used as a measure of aflatoxins activity in animals. Increased activities of sorbitol dehydrogenase, glutamic dehydrogenase, lactate dehydrogenase, alkaline phosphatase, acid phosphatase, aspartate aminotransferase and alanine aminotransferase were reported in aflatoxicated chickens (Leeson et. al., 1995). The results obtained from this investigation showed increased activity of the liver enzymes GGT, AST and ALT and a marked decrease in LDH in the serum of rats fed with aflatoxin-contaminated feeds when compared to the control group. AST and ALT results in this study is in agreement with the observation of Leeson et. al. (1995), that an increase in the levels of serum enzymes measured is interpreted as a consequence of hepatocyte degeneration and subsequent leakage of enzymes. The marked decrease in LDH activity is consistent with the findings of Devendran & Balasubramanian (2011) who reported that the marked decrease in the activity of hepatic LDH with aflatoxin treatment indicates impaired liver function.
Histopathological analysis showed hepatocytes necrosis of the groups fed with aflatoxin contaminated feeds. According to Clifford and Rees (1966) this effect was due to the role of the toxin in inhibiting RNA-Polymerase and altering cellular membrane which play a role in the development of the histological necrosis. The result also showed that the severity of hepatocytes damage or necrosis was directly proportional to the concentration of aflatoxins present in the feed. The photomicrographs of the liver architecture reflect the differences observed in the liver enzyme activities. Hence it can be said that aflatoxins are responsible for the degeneration in hepatocytes observed. The present study showed the deleterious effect (hepatic toxicity) of aflatoxins on the subject. The liver is a very important organ of metabolism in the body hence any form of toxicity can lead to other metabolic disorders in the body.
Acknowledgement
Management and Staff of the Laboratory of National Agency for Food and Drug Administration Control (NAFDAC), Port Harcourt Area, Rivers State, Nigeria.
References
- Abt Associates. (2012). Aflatoxin Contamination and Potential Solutions for Its Control in Nigeria: A summary of the country and economic assessment conducted in 2012 and the aflatoxin stakeholder workshop held on November 5 and 6, 2012 in Abuja.
- Adejumo, T.O. & Orole, O.O. (2015). Carcinogens in West Africa with Special Reference to Fungal Metabolites from Fusarium species. Journal of Biology, Agriculture and Healthcare, 5(8), pp. 21-46.
- Agag, B.I. (2004). Mycotoxins in foods and feeds 1-Aflatoxins. Assiut University Bulletin for Environmental Researches, Vol.7, No.1, pp.173-205.
- Ayejuyo, O.O., Olowu, R. A., Agbaje, T.O., Atamenwan, M. & Osundiya, M.O. (2011). Enzyme - Linked Immunosorbent Assay (ELISA) of Aflatoxin B1 in Groundnut and Cereal Grains in Lagos. Nigeria Research Journal of Chemical Sciences, 1(8), 1-5.
- Bandyopadhyay, R.P., Kumar, M. & Leslie, J.F. (2007) Relative Severity of Aflatoxin Contamination of Cereal Crops in West Africa. Food Additives and Contaminants, 24 (10), pp. 1109-1114.
- Brown, H.S. (2002). Hematoxylin and eosin (the routine stain). H&H informational primer. Sigma-Aldrich Corporation, pp 1–3.
- Clifford, J.I. & Rees, K.R. (1966). Action of Aflatoxin on Rat Liver. Biochemical Journal (1967) 102, 65 p 66-75.
- Devendran, G. & Balasubramanian, U. (2011) Biochemical and histopathological analysis of aflatoxin induced toxicity in liver and kidney of rat. Asian Journal of Plant Science and Research, 1 (4):61-69.
- Dhanasekaran, D., Shanmugapriya, S., Thajuddin, N. & Panneerselvam, A. (2011). Aflatoxins and Aflatoxicosis in Human and Animals: In Ramón Gerardo Guevara-González Aflatoxins - Biochemistry and Molecular Biology, InTech, Croatia.
- Diaz, G.J., Calabrese, E. & Blain, R., (2008). Aflatoxicosis in chickens (Gallus gallus): A Review of History and Contemporary Issues. Toxins, 3, 566-590.
- Fouzia, B. & Samajpati, N. (2000). Mycotoxins production on rice, pulses and oilseeds. Naturwissenschaften, Vol.87, pp.275-277.
- Kubena L. F., Harvey R. B., Bailey R. H., Buckley S. A. & Rottinghaus G. E.(1998). Effects of hydrated sodium calcium aluminosilicate (T-Bind™) on mycotoxicosis in young broiler chickens. Poultry Science, 77:1502–1509.
- Leeson, S., Diaz, G.J. & Summers, J.D. (1995). Poultry metabolic disorders and mycotixns. pp. 249-298, University Books, Guelph, Ontario, Canada
- Liu Y. & Wu F. (2010). Global Burden of Aflatoxin-Induced Hepatocellular Carcinoma: A Risk Assessment. Environmental Health Perspectives, 118(6), pp. 818-824.
- Marin, D.E., Taranu, I., Bunaciu, R.P., Pascale, F., Tudor, D.S., Avram, N., Sarca, M., Cureu, I., Criste, R.D., Suta, V. & Oswald, I.P., (2002). Changes in performance, blood parameters, humoral and cellular immune responses in weanling piglets exposed to low doses of aflatoxin. Journal of Animal Science, 80,1250-1257.
- Mushtaq, M., Sultana, B., Anwar, F., Khan, M.Z. & Ashrafuzzaman, M. (2012) Occurrence of aflatoxins in selected processed foods from Pakistan. International Journal of Molecular Sciences, 13, 8324-8337.
- Standards Organization of Nigeria (SON). (2003). "Standard for Maize Grit," National Industrial Standard 253:2003,
- Standards Organization of Nigeria (SON). (2006). "Standard for Groundnut Seed," National Industrial Standard 491:2006.
- Standards Organization of Nigeria (SON). (2008). "Standard for Kulikuli (Groundnut cake)." National Industrial Standard 594:2008.
- Strosnider, H., Azziz-Baumgartner, E., Banziger, M., Bhat, R.V., Breiman, R., Brune, M., DeCock, K., Dilley, A., Groopman, J., Hell, K., Henry, S.H., Jeffers, D., Jolly, C., Jolly, P., Kibata, G.N., Lewis, L., Liu, X., Luber, G., McCoy, L., Mensah, P., Miraglia, M., Misore, A., Njapau, H., Ong, C., Onsongo, M.T.K., Page, S.W., Park, D., Patel, M., Phillips, T., Pineiro, M., Pronczuk, J., Schurz Rogers, H., Rubin, C., Sabino, M., Schaafsma, A., Shephard, G., Stroka, J., Wild, C., Williams, J.T. & Wilson, D. (2006). "Workgroup Report: Public Health Strategies for Reducing Aflatoxin Exposure in Developing Countries." Environmental Health Perspectives, 114:1989-1903.
- Tulayakul, P., Sakuda, S., Dong, K.S. & Kumagai, S. (2005). Comparative activities of glutathione-S-transferase and dialdehydereductase toward aflatoxin B1 in livers of experimental and farm animals. Toxicon, Vol.46, No.2, pp. 204-209.
- Yunus, A. W., Ghareeb, K., Abd-El-Fattah, A. A. M., Twaruzek, M. & Bohm, J. (2011). Gross intestinal adaptations in relation to broiler performance during a chronic aflatoxin exposure. Poultry Science, 90: 1683-1689.


