
Agricultural and Biological Sciences Journal, Vol. 1, No. 5, October 2015 Publish Date: Jun. 17, 2015 Pages: 177-182
Comparison of the Growth Performance and Economic Viability of Four Marine Fish Species Under Cage Culture on the South Coast of Indian Ocean
Judith W. Muya*, Julius O. Manyala
Department of Fisheries and Aquatic Sciences, School of Natural Resources, University of Eldoret, Eldoret, Kenya
Abstract
The importance of aquaculture has become more apparent at present, with higher demanding pressure from an ever-increasing world population. However, the industry is facing copious challenges the major one being the need to obtain a perfect balance between precipitous fish growth and optimum use of the stocked feed. In any aquaculture system, the cost of feeds accounts for approximately 40 - 60% of the operating costs in intensive culture systems. These costs highly affect the output since the economic viability of any culture operation depends on the feed and feeding frequency. The relevance of fish farming in the aquaculture context lies in the urgent need for income generation. The economic viability of any specie lies in its ability to consume less and produce more. This study therefore sought to determine the growth performance in relation to economic viability of four fish species (rabbit fish (Siganusvermiculatus), red snapper (Lutjanusargentimaculatus), milk fish (Chanoschanos) and groupers (Epinephelusfuscoguttatus)) under cage culture. The experiment consisted of 16 floating cages, four cages for each species and each cage holding a total of 50 juvenile fish of weight between 50-70 gm, reared for six months. Monthly variations of mean weight for each species in each of the cages show that groupers had the highest final body weight (242 ± 10.2 g). The groupers had the highest Percent Weight Gain (PWG) (290.3%) followed by milk fish (168.6%). The Specific Growth Rate (SGR) was also highest for the grouper (0.89%) as compared to milkfish (0.65%), rabbit fish (0.53%) and red snapper (0.33%). Groupers had the highest length – weight relationship value (R2) of 96.6%. The milk fish recorded the highest Feed Conversion Ratio (FCR) (38.9 ± 2.68). As for the economic value, milk fish also had the highest value of 4,050 for the catch of 162. Based on the results it is concluded that groupers is the best candidate for culture as compared to the other three test species. It is recommended that intensive pilot culture of groupers be undertaken in cages to develop an enterprise budget and business plan for commercial investment to improve livelihoods of the coastal community and at the same time, open up the opportunities for further research on nutrition, husbandry and further research on growth requirement of groupers.
Keywords
Growth Performance, Economic Viability, Cage Culture, Fish Species
Received:April 9, 2015
Accepted: May 10, 2015
Published online: June 14, 2015
@ 2015 The Authors. Published by American Institute of Science. This Open Access article is under the CC BY-NC license. http://creativecommons.org/licenses/by-nc/4.0/
Contents
1. Introduction 2. Materials and Methods 3. Results and Discussion 3.1. Monthly Fish Weight 3.2. Monthly Fish Length 3.3. Percent Weight Gain 3.4. Specific Growth Rate 3.5. Length-Weight Relationship 3.6. Growth Patterns and Condition Factor 3.7. Feed Conversion Ratio 3.8. Economic Value 4. Conclusion Recommendations
1. Introduction
Over the last 50 years, aquaculture has become a worldwide industry. Gordon (2003) observed that aquaculture production has realized over global 40% growth over the previous two decades. The aquaculture industry is rapidly expanding. In 2012, the production totaled 158 million tonnes - around 10 million tonnes more than 2010 (FAO, 2014).
The importance of aquaculture has become even more apparent at present, with higher demanding pressure from an ever-increasing world population. However, the industry is facing copious challenges the major one being the need to obtain a perfect balance between precipitous fish growth and optimum use of the stocked feed (Abid& Ahmed, 2009). In any aquaculture system, the cost of feeds accounts for approximately40 - 60% of the operating costs in intensive culture systems (Sudaryono, 2011). These costs highly affect the output since the economic viability of any culture operation depends on the feed and feeding frequency.
Undoubtedly, well-balanced diets and their ample feeding to the fishes is a major requirement for successful culture operations. However, food preferences, capacity and feeding behaviors could vary enormously from one fish species to another (Suárezet al., 2009). The extent of feed ingestions a result of a number of interacting factors between the fish(senses and hormonal systems) and its environment (size range or variability, stock density, season, day length and time of the day) (Claireaux&Lefrançois, 2007).
Many researchers have reported that feeding frequency and time of feeding have affect feed intake and growth performance in goldfish(Carassiusauratus) (Narnawareet al., 2000), Finfish (Webster& Lim, 2002),channel catfish, Ictaluruspunctatus(Silversteinet al., 2001) and Black sea trout Salmotruttalabrax (Başçınaret al., 2007).The relevance of fish farming in the aquaculture context lies in the urgent need for income generation. The economic viability of any specie lies in its ability to consume less and produce more. This study therefore sought to determine the growth performance in relation to economic viability of four fish species (rabbit fish (Siganusvermiculatus), red snapper (Lutjanusargentimaculatus), milk fish (Chanoschanos) and groupers (Epinephelusfuscoguttatus)) under cage culture. The study was biased towards these four species because they appear to have considerable potential and have been recommended for feasibility studies for cage culture in an attempt to determine their performance (Ariyaratne, 2000).
2. Materials and Methods
The study was carried out from April to Nov 2012 in the Kenyan Coast (South Coast of Indian Ocean) at Makongeni Village, Kinondo location, Diani division, Msambweni district, Kwale County.
The experiment consisted of 16 floating cages at a stocking rate of 50 juvenile fish of between 50-70 gm which were reared for five months. The net cages were hanged on wooden frames and were kept afloat by plastic drum and anchored on mangrove trees using polyethylene twine. Metal stands were also used to anchor the net cages above the sea bed. The mesh size of the net was of 3.8 cm to prevent fouling more rapidly.
The cage - nets were cleaned regularly to prevent excessive fouling and to prevent net breakage and heavy losses of fish. The method of cleaning nets involves fish transfer, drying the nets for about 2 days, manually removing the dead fouling agents, dipping in sea water for some hours, inspection and mending of spoilt ones. When nets were in use, care was taken to ensure that there were no loose knots or holes in the net which would allow the fish to escape.
Seeds were collected from the wild through trap method, seining and hook and line at the lagoon near the shore and transferred to the cages using a raft which has net-cage to hold the juvenile fish. After stocking, the fish were reconditioned for one month after which feeds were introduced. A formulated diet of fishmeal and maize bran at a ratio of 1:2 to make a meal of 30% protein was used to feed the fish. The fish were reared for six months and were fed at 3% of their body weight twice a day, resulting in a daily ration of 6% of the body weight.
For periodic sampling purposes, a mosquito seine net was used to seine inside the cages to get fish. After collection the length and weight of the fish was taken. This was conducted in triplicates and bi-weekly. The length was measured in centimeters and weight in grams by use of a fish measuring board and an electronic scale of a capacity of 5 kg by 1g.
The data generated was entered in an excel spreadsheet for storage and management. This data was then analysed using MINITAB version 14 software. The monthly weight was analysed for Percent Weight Gain (PWG) using the formula:
![]()
where;
![]() = Mean final fish weight
= Mean final fish weight
![]() = Mean initial fish weight
= Mean initial fish weight
Growth in wet weight of the fish was expressed as the Specific Growth Rate (SGR, % day-1) using the formula below (Schramet al., 2009):
![]()
where;
![]() = Mean final fish weight
= Mean final fish weight
![]() = Mean initial fish weight
= Mean initial fish weight
Food Conversion Ratio (FCR) was further computed from the results to show the efficiencies of these species in converting feed into body weight. This was calculated as follows (Nayloret al., 2009):
![]()
where;
TFI = Total feed ingested (g)
WG = Weight gain (g)
The data on length and weight was log-transformed and used to determine the length-weight relationship and the condition factor of each fish using regression analysis using the following relationship:
Log W = Log a + Log TL
where;
W = Fish weight (g)
TL = Total Length (cm)
While the condition factor Kn was calculated as follows
Kn = W/(aTLb)
Where
W = Fish weight (g)
TL = Total Length (cm)
3. Results and Discussion
3.1. Monthly Fish Weight
The highest final body weight was that of groupers (242 ± 10.2 g), followed by that of milk fish (150.4 ± 4.80g) and red snappers (125 ± 7.02 g). Rabbit fish had the lowest final weight of 101 ± 3.63g. The statistical analysis revealed significant differences among the body weight of the four fish species (F = 80.61 P< 0.0001). On pair wise comparison (Table 1), the final weight of red snappers did not vary significantly from that of rabbit fish but varied significantly from all the other species. It was also observed that the final weight of groupers contributed much to the variation between the four species.
The comparison of body weight of the four species during the six months revealed that in the first month the mean body weight was not significantly different from each other. During second and third months, the means body weights of milk fish, red snappers and rabbit fish were not significantly different from each other but the groupers showed significantly higher value. During fourth month until the sixth month, only rabbit fish and red snappers did not vary significantly from one another.
Table 1. Monthly average fish weight ± SEM (g) during the study period (n= 200;).
| Fish Type | June | July | August | September | October | November |
| Milk Fish | 56.0 ± 2.45 | 64.8 ±2.44 | 76.0 ± 1.3 | 94.8 ± 5.30 | 116.4 ± 6.08 | 150.4 ± 4.80 |
| Red Snapper | 61.2 ± 3.01 | 66.4 ± 3.67 | 70.2 ± 2.99 | 78.8 ± 5.32 | 92.8 ± 3.20 | 125.0 ± 7.02 |
| Rabbit Fish | 55.4 ± 1.63 | 61.4 ± 1.40 | 75.0 ± 0.894 | 79.8 ± 1,85 | 108.2 ± 5.8 | 101.0 ± 3.63 |
| Groupers | 62.0 ± 2.21 | 97.4 ± 5.01 | 127.8 ± 14.5 | 175.2± 8.18 | 210.2 ± 7.39 | 242.0 ± 10.2 |
Table 2. Monthly average fish length ± SEM (g) during the study period.
| Fish Type | June | July | August | September | October | November |
| Milk Fish | 19.6± 0.25 | 20.4± 0.37 | 21.4 ± 0.4 | 22.0 ± 0.45 | 23.3 ± 0.62 | 24.1 ± 0.53 |
| Red Snapper | 13.2± 0.58 | 14.8± 0.37 | 15.6 ± 0.19 | 16.5 ± 0.22 | 17.1 ± 0.19 | 17.5 ± 0.22 |
| Rabbit Fish | 14.9± 0.19 | 15.6± 0.19 | 17.0 ± 0.16 | 17.2 ± 0.23 | 18.5 ± 0.52 | 19.5 ± 0.52 |
| Groupers | 16.4± 0.43 | 18.1± 0.33 | 20.8 ± 1.06 | 23.6 ± 0.43 | 25.2 ± 0.26 | 26.1 ± 0.40 |
Table 3. Monthly and overall percent weight gain (%) of the four studied fishes during the study period.
| Sampling Months | Milk Fish | Red Snappers | Rabbit Fish | Groupers |
| June | 15.7 | 8.4 | 10.8 | 57.1 |
| July | 17.3 | 5.7 | 22.2 | 31.2 |
| August | 24.7 | 12.3 | 6.4 | 37.1 |
| September | 22.8 | 17.8 | 35.6 | 20 |
| October | 29.2 | 8.8 | 15.5 | 15.1 |
| Overall | 168.6 | 65.03 | 125.6 | 290.3 |
3.2. Monthly Fish Length
The highest mean final length of fish (Table 2) was for the groupers (26.1 ± 0.4 cm), followed by milk fish (24.1 ± 0.534 cm) and rabbit fish (19.5 ± 0.524 cm). Red snappers had the lowest mean final length (17.5 ± 0.224 cm). The variations between the four species in final total length was significant (F = 82.35, p < 0.0001). During the first three months of study, the milk fish had the highest average length but this changed during the fourth month when the groupers grew past milk fish in length (Table 2). The red snappers were however shorter from month one all the way to the last month.
3.3. Percent Weight Gain
Table 3 shows that the groupers had the highest final percent weight gain (290.3%) followed by milk fish (168.6%) and rabbit fish (125.6%). The red snappers had the lowest percent weight gain (65.03%). The monthly percent weight gain of milk fish increased every month from 15.7% during the first month to 29.2% during the last month of study. The monthly percent weight gain of groupers on the other hand reduced every month from 57.1% during the first month to 15.1% during the last month. The monthly percent weight gain for rabbit fish and red snappers were oscillating.
3.4. Specific Growth Rate
On specific growth rate (Fig. 1), groupers showed the highest value (0.89%) followed by milk fish (0.65%) and rabbit fish (0.53%) whereas red snappers had the lowest specific growth rate of 0.33%. The specific growth rate for milk recorded a monthly increase while that of groupers showed a monthly decline. Rabbit fish however exhibited an oscillatory trend in monthly specific growth rate. The red snappers though had the lowest specific growth rate showed a monthly increase from the month of stocking.
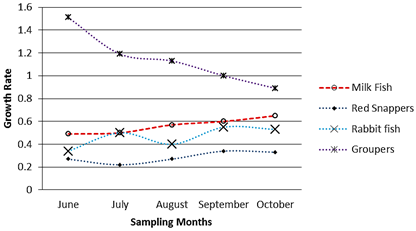
Fig. 1. Specific growth rates of fishes sampled during the study period.
Even though factors like feeding and feed types, water quality variables, and fish type determine the rate of growth (Zaikov and Hubenova, 2008), for this study, all factors were constant except fish type. The groupers gained higher body weight and maximum total length over the entire study period, followed by milk fish. The overall growth pattern of fingerlings also remained highest for groupers. In groupers, the higher mean body weight encountered at the end of the culture suggests better growth performance as compared to the other three species. Under the conditions of the present study, the discrepancy in growth performance between the four fish species was not about other external variables but fish type since all the species were subjected to similar conditions. The faster growth rate obtained in the length of groupers further supports the idea that it has better growth performance as compared to the other three species. Faster growth is a desirable trait in aquaculture since it yields good production and hence can be profitable in terms of food and income.
3.5. Length-Weight Relationship
Were observed regression outputs for the length-weight relationships for the four species studied (Figure 2 to 5). Groupers had the highest R2 value of 96.6% showing that the data fitted well in the linear regression model. The lowest R2 value was with milk fish which was 80%. Generally all the four species fitted well in a linear regression model.
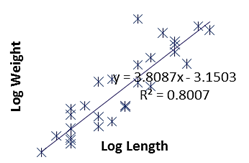
Fig. 2. Length-weight relationship (Milk Fish).
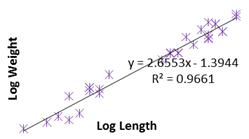
Fig. 3. Length-weight relationship (Rabbit Fish).
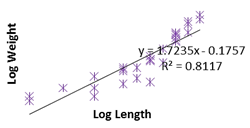
Fig. 4. Length-weight relationship (Red Snapper).
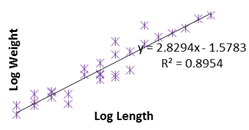
Fig. 5. Length-weight relationship (Groupers).
3.6. Growth Patterns and Condition Factor
Growth patterns in fish are predicted by considering the value of the growth exponent in a length-weight relationship. The pattern is isometric when the exponent b is 3; any deviation from this shows allometry in the growth of fish which can be negative (b < 3) or positive allometry (b > 3). From this study, only the milk fish depicted a positive allometry while the other three species showed negative allometry and none had an isometric growth (Table 4).
Table 4. Growth exponent and Growth patterns of the four fish species studied.
| Fish Species | b | kn | r2 | Growth pattern |
| Milk Fish | 3.808 | 1.527148 | 0.8 | Positive allometry |
| Red Snappers | 1.723 | 1.005539 | 0.811 | Negative allometry |
| Rabbit Fish | 2.829 | 1.021429 | 0.895 | Negative allometry |
| Groupers | 2.655 | 1.013369 | 0.966 | Negative allometry |
3.7. Feed Conversion Ratio
The worst FCR values was obtained in the red snappers (92.3 ± 8.35), followed by rabbit fish (52.8 ± 11.2) and milk fish (38.9 ± 2.68). A relatively lowest FCR was obtained for the groupers (20.4 ± 1.99). The overall mean values of FCR for all the four fish species were significantly different from each other (Fig. 6). The ANOVA test results gave an F value of 8.59 and p-value of 0.036.
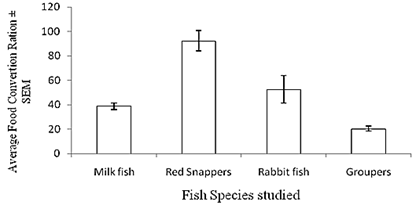
Fig. 6. Food Conversion Ratio (FCR) for the four species studied.
Table 5. Estimated Economic values of the four fish species after the growth period.
| Species | Final weight | Price/Kg (KSh.) | Value/piece (V) | Number (N) | Total value |
| (Stocked – Mortalities) | |||||
| Milk Fish | 150.4g | 165 | 25 | 162 | 4,050 |
| Red Snappers | 101g | 200 | 20 | 182 | 3,640 |
| Rabbit Fish | 125g | 175 | 22 | 187 | 4,114 |
| Groupers | 242g | 165 | 40 | 196 | 7,840 |
3.8. Economic Value
Red snappers had the highest market price of Shs. 200 Kg-1 on average, while milk fish and groupers attracted prices of Shs. 165 Kg-1 each on average. Rabbit fish on the other hand was selling at average price of shs. 175 Kg-1 (Table 5). However, based on the final weight, groupers were found to sell for Shs. 40 apiece which was twice the price of a piece of red snapper due to size difference.
4. Conclusion
Based on the results of the study, the groupers had the highest economic value followed by milk fish then rabbit fish and finally the red snappers. This is because the groupers had the highest growth exponent and growth patterns. In addition, they had the highest feed conversion ratio, specific growth rate; percent weight gain, monthly fish length and monthly fish weight.
Recommendations
Based on the results and conclusions from this study, the following are recommended;
i) Intensive production of groupers should be promoted in the Kenyan coast to boost the economy of the coastal community.
ii) A further study should be conducted to determine ways of improving the welfare of groupers and milk fish which may eventually improve its efficiency in food conversion.
References
- Abid, M., & Ahmed, M. S. (2009). Growth response of Labeorohita fingerlings fed with different feeding regimes under intensive rearing. J. Anim. Pl. Sci, 19, 45-49.
- Ariyaratne, M.H.S. (2000). Some aspects of farm rearing of post-larvae and fry of commonly cultured carps (Pisces: Cyprinidae), and development of methodology suitable for rearing of post-larvae and fry by rural communities of Sri Lanka. M. Phil. thesis. Postgraduate Institute ofScience, University of Peradeniya, Peradeniya, Sri Lanka.
- Başçınar, N., Çakmak, E., Çavdar, Y., &Aksungur, N. (2007).The effect of feeding frequency on growth performance and feed conversion rate of black sea trout (Salmotruttalabrax Pallas, 1811).Turkish journal of Fisheries and Aquatic sciences, 7(1).
- Claireaux, G., &Lefrançois, C. (2007).Linking environmental variability and fish performance: integration through the concept of scope for activity.Philosophical Transactions of the Royal Society B: Biological Sciences, 362(1487), 2031-2041.
- Food and Agriculture Organization, FAO.(2014, May).Report highlights growing role of fish in feeding the world. RetrievedApril6, 2015, from http://www.fao.org/news/story/en/item/231522/icode/.
- Gordon, J.D.M.(2003). The Rockall Trough, North East Atlantic: the cradle of deep-sea biological oceanography that is now being subjected to unsustainable fishing activity. Journal of Northwest Atlantic Fishery Science,31, 57-83.
- Narnaware, Y. K., Peyon, P. P., Lin, X., & Peter, R. E. (2000).Regulation of food intake by neuropeptide Y in goldfish.American Journal of Physiology-Regulatory, Integrative and Comparative Physiology, 279(3), R1025-R1034.
- Naylor, R. L., Hardy, R. W., Bureau, D. P., Chiu, A., Elliott, M., Farrell, A. P., ...& Nichols, P. D. (2009). Feeding aquaculture in an era of finite resources.Proceedings of the National Academy of Sciences, 106(36), 15103-15110.
- Schram, E., M. C. J. Verdegemb, R. T. O. B. H. Widjaja, C. J. Kloet, A. Foss, R. Schelvis-Smit, B. Roth, A. K. Imsland (2009). "Impact of increased flow rate on specific growth rate of juvenile turbot (Scophthalmusmaximus, Rafinesque 1810)".Aquaculture 292: 46–52.
- Silverstein, J. T., Bosworth, B. G., Waldbieser, G. C., &Wolters, W. R. (2001). Feed intake in channel catfish: is there a genetic component?.Aquaculture Research, 32(s1), 199-205.
- Suárez, J. A., Gaxiola, G., Mendoza, R., Cadavid, S., Garcia, G., Alanis, G. & Cuzon, G. (2009).Substitution of fish meal with plant protein sources and energy budget for white shrimp Litopenaeusvannamei (Boone, 1931).Aquaculture, 289(1), 118-123.
- Sudaryono, A. (2011). Comparison of Lupin Meal Based Diets Cost Efficiency for Juvenile Penaeusmonodon Tested Under Pond Conditions. Journal of Coastal Development, 8(1), 46-51.
- Webster, C. D., & Lim, C. (Eds.).(2002). Nutrient requirements and feeding of finfish for aquaculture.Cabi.
- Zaikov, A. I. and Hubenova, T. (2008). Investigation on growth rate and food conversion ratio of wels (Silurusglanis L.) in controlled conditions. Bulg. J. Agric. Sci., 14: 171-175.


