
Agricultural and Biological Sciences Journal, Vol. 1, No. 4, August 2015 Publish Date: Jun. 16, 2015 Pages: 167-176
Variation of Growth, Yield and Protein Content of Transplant Aman Rice by Three Agronomic Practices
Susmita Ray, Md. Abdur Rahman Sarkar, Swapan Kumar Paul, A. K. M. Mominul Islam*, Sabina Yeasmin
Department of Agronomy, Bangladesh Agricultural University, Mymensingh, Bangladesh
Abstract
The research work was conducted to find out the effect of variety, spacing of transplanting and nitrogen (N) rate on the growth, yield and protein content of transplant aman rice. The experiment consisted of three rice varieties: BR11, BRRI dhan49 and BRRI dhan56; two spacings of transplanting: 25 cm × 15 cm and 20 cm × 10 cm; and three N-levels: 0, 60 and 80 kg N ha-1. Morpho-physiological characters, yield contributing characters and yield of transplant aman rice were significantly influenced by variety, spacing of transplanting and N rate. Experimental results indicated that BRRI dhan49 in combination with 25 cm × 15 cm spacing and 80 kg N ha-1 gives the highest leaf area index, total dry matter content, crop growth rate, number of effective tillers hill-1 and number of grains pancle-1, and lowest number of sterile spikelets panicle-1 and sterility percentage of grain. These growth and yield parameters attributed the highest grain yield (5.51 t ha-1) by this combination. In terms of grain protein content variety BR11 combination with spacing 20 cm × 10 cm with 80 kg N ha-1 appears the highest (9.05%). The value was statistically similar with the combination of BRRI dhan49, 25 cm × 15 cm spacing and 80 kg N ha-1 (8.91%). Therefore, it can be concluded that BRRI dhan49 combined with 25 cm × 15 cm spacing and fertilization with 80 kg N ha-1 appears as the promising practice for the maximization of grain yield and protein content of transplant aman rice.
Keywords
Aman Rice, Leaf Area Index, Total Dry Matter, Crop Growth Rate, Protein Content
Received: April 6, 2015
Accepted: April 18, 2015
Published online: June 14, 2015
@ 2015 The Authors. Published by American Institute of Science. This Open Access article is under the CC BY-NC license. http://creativecommons.org/licenses/by-nc/4.0/
Contents
1. Introduction 2. Materials and Methods 2.1. Experimental Site, Soil and Climatic Conditions 2.2. Experimental Treatments and Design 2.3. Collection and Sprouting of Seed 2.4. Preparation of Seedling Nursery and Seed Sowing 2.5. Preparation of Experimental Land 2.6. Fertilizer Application 2.7. Sampling, Harvesting and Processing 2.8. Growth Parameters 2.9. Yield Components 3. Results 3.1. Effects on Growth Parameters 3.2. Effects on Yield Contributing Characters and Yield 4. Relationships of Leaf Area Index and Total Dry Matter with Grain Yield 5. Discussion 6. Conclusions
1. Introduction
Rice (Oryza sativa L.) is an important cereal crop and the staple food for more than two billion people in Asia, and for hundreds of millions people in Africa and Latin America (Maqsood et al. 2013). As large number of people are dependent on rice, its yield should be increased by over 5 × 10⁶ t year-1 just to keep pace with increasing population (IRRI 1997). However, except few developed countries, its actual yield is far below than expected. One of the potential reasons for this yield gap is possibly due to inappropriate agronomic management practices.
Optimum plant spacing ensures plants to grow properly utilizing more solar radiation and nutrients (Khan et al. 2005; Islam et al. 2007; Mohaddesi et al. 2011). Plant spacing has direct effects on the normal physiological activities of crops through intra-specific competition (Oad et al. 2001). For example, when plant density exceeds the optimum level, competition among plants for above or below ground resources becomes severe and consequently decreases the grain yield (Moradi and Azarpour 2011; Thawait et al. 2014). In contrast, wider spacing increases the number of tillers hill-1but decreases the hills unit-1 area which results in low grain yield (Gozubenli, 2010; Wang et al. 2010; 2014). To date no single spacing has been recommended as ideal for all field conditions and/or varieties. Therefore, for a particular soil and/or varieties it should be established experimentally.
Nitrogen (N) is a primary essential plant nutrient that plays a significant role in growth, yield and quality of rice. The important role of N-fertilizers in increasing rice yields has been widely recognized. N is an integral part of protoplasm, protein and chlorophyll and plays a remarkable role in increasing cell size, dry matter productions and ultimately increases rice yield (Bufogle et al. 1997; Norman et al. 1992). Plant growth is seriously hampered when lower dose of N is applied which drastically reduces the yield (Khatab et al. 2013). However, excess amount of N-fertilizer also results in lodging of plants, prolonging growing period, delayed in maturity, increased the susceptibility to insect-pest and diseases and ultimately reduces yield (Uddin, 2003). Therefore, optimum dose of N-fertilizer application and its efficient management are necessary for increasing rice yields.
Protein content is an important parameter for rice grain quality as high protein content improves the whole-grain or head rice content (Jongkaewwattana et al. 1993). A rice variety with high-protein content is more resistant to abrasive milling than low-protein content rice of the same (Perez et al. 1996). Head rice is more valuable and preferred by consumers than broken rice. Rice grain protein content also has importance in terms of human nutrition intake in most of the South Asian countries as rice is the staple source of protein. A slight increase in grain protein content will induce daily protein intake as rice is the major source of daily energy and consumed in very large amounts in this region (Chandel et al. 2010). In an average Bangladeshi diet, rice is still the dominant source of energy and protein. Of the 2318 kcal, 69% of the total calorie and 50% of total protein come from rice (Hussain 2012). Rice proteins are also considered to have the highest biological value among all the cereals (Eggum 1975). To date very few researches have been conducted to find out the grain protein content of most popular rice verities cultivated in this region.
Among the five distinct rice ecotypes of Bangladesh (boro, transplanted aus, transplanted aman, upland or direct-seeded aus and deep-water or floating rice), aman rice is the major rice ecotype that is grown completely under rainfed ecosystems. In addition, aman rice is the second largest rice ecotype of the country in terms of volume of production while boro tops the production. Moreover, the area coverage of aman is the largest as a single crop and boro remains the second. Among the aman rice cultivars that are commonly grown in Bangladesh BR11, BRRI dhan49 and BRRI dhan56 are most popular to the growers. The present study was therefore undertaken to determine the effects of variety, spacing of transplanting and N-levels on the growth, yield and protein content of transplant aman rice. The findings of this research would be helpful to the farmers to select appropriate management practices to maximize the grain yield and protein content of transplant aman rice.
2. Materials and Methods
2.1. Experimental Site, Soil and Climatic Conditions
The experiment was carried out at the Agronomy Field Laboratory, Bangladesh Agricultural University, Mymensingh during the period from June to November, 2013 (Aman season). This experimental site is located at 90º25'45.7" E longitude and 24º43'07.3'' N latitude (central coordinates) having an altitude of 18 m above the mean sea level. The site belongs to the Sonatala series of ‘Old Brahmaputra Floodplain’ agro ecological zone (AEZ-9) of Bangladesh having non-calcareous dark grey floodplain soils (FAO-UNDP, 1988; Islam et al. 2011). The experimental plot is medium high land having sandy loam with pH 6.8, and organic matter content is low.
The experimental area is under the sub-tropical climate. The average monthly temperature (°C), relative humidity (%), total rainfall (mm) and sunshine (h) prevailing at the experimental site during experimentation are presented in Table 1.
2.2. Experimental Treatments and Design
Three factors were included in the experiment viz. three varieties (BR11, BRRI dhan49 and BRRI dhan56), two spacing of transplanting (25 cm × 15 cm and 20 cm × 10 cm) and three levels of N rate (0, 60 and 80 kg N ha-1). The experiment was laid out in randomized complete block design (RCBD) with three replications. Each of the replications represented a block in the experiment. Each block was divided into 18 unit plots, where the 18 treatment combinations were allocated at random. Altogether there were 54 unit plots in the experiment. The net size of each unit plot was 4.0 m × 2.5 m. The spaces between replications and between plots were 1 m and 0.5 m, respectively.
2.3. Collection and Sprouting of Seed
Certified seeds of BR11 and BRRI dhan49 were collected from the Bangladesh Agricultural Development Corporation (BADC), Mymensingh and seeds of BRRI dhan56 were collected from Bangladesh Rice Research Institute (BRRI), Joydebpur, Gazipur. Healthy seeds were selected by specific gravity method. Seeds were then soaked in water for 24 h. Thereafter, seeds were taken out of water and kept thickly in gunny bags. The seeds started sprouting after 48 h of steeping and were sown after 72 h.
Table 1. Monthly record of air temperature, rainfall, relative humidity and sunshine of the experimental site during the growing season.
| Month | Year | Monthly Average air temperature (°C) | Monthly Average Rainfall (mm) | Monthly Average Humidity (%) | Average Sunshine (h day-1) | Solar Radiation (w/m2) | ||
| Maximum | Minimum | Average | ||||||
| June | 2013 | 33.1 | 26.5 | 29.8 | 236.2 | 82.1 | 145.9 | 11795.80 |
| July | 2013 | 32.3 | 26.8 | 29.5 | 338.8 | 84.1 | 120.7 | 11452.31 |
| August | 2013 | 31.7 | 26.2 | 29.0 | 317.4 | 85.7 | 113.3 | -5835.25 |
| September | 2013 | 32.4 | 26.2 | 29.3 | 131.6 | 85.5 | 132.0 | 10137.32 |
| October | 2013 | 30.5 | 23.7 | 27.1 | 262.6 | 86.9 | 140.9 | 9693.28 |
| November | 2013 | 29.6 | 16.1 | 23.1 | 0.0 | 81.6 | 218.1 | 10633.62 |
| December | 2013 | 25.1 | 13.6 | 19.4 | 0.6 | 64.5 | 97.5 | 7772.72 |
2.4. Preparation of Seedling Nursery and Seed Sowing
A piece of land was selected in the Agronomy Field Laboratory, BAU, Mymensingh for raising seedling. The land was properly puddled with country plough, cleaned and levelled with ladder. Then sprouted seeds were sown in the nursery beds. Proper care was taken to raise the seedlings in the seedbed. No manuring or fertilization was done in the nursery bed.
2.5. Preparation of Experimental Land
The experimental land was first opened with a power tiller. Then the land was prepared by ploughing and cross ploughing with a country plough and subsequently levelled by laddering. All weeds and stubble were removed from the land. The field layout was accomplished according to the experimental design adopted.
2.6. Fertilizer Application
The land was fertilized with triple super phosphate (TSP), muriate of potash (MoP), gypsum and zinc sulphate at the rate of 90, 75, 60 and 8 kg ha-1, respectively. The entire amounts of TSP, MoP, gypsum and zinc sulphate were applied at final land preparation. Nitrogen was applied in the form of urea as per treatment of the experiment i.e. 0, 60 and 80 kg N ha-1in three equal splits at 15, 30 and 45 days after transplanting (DAT).
2.7. Sampling, Harvesting and Processing
The crop was harvested at full maturity. The date of harvesting was confirmed when 90% of the seed became golden yellow in color. Five hills (excluding border rows and central 1 m2 area) were selected randomly from each unit plot and uprooted for recording data. After sampling, a central area of 1m × 1m was selected from each unit plot as harvest area. BRRI dhan56 was harvested twenty days earlier than BRRI dhan49 and about one month earlier than BR11. The harvested crop of each plot was separately bundled, properly tagged and then brought to threshing floor. The crop was threshed by pedal thresher and the fresh weights of grain and straw were recorded plot-1. The grains were cleaned and sun dried to moisture content of 14%. Finally grain and straw yields plot-1 were recorded and converted to t ha-1.
2.8. Growth Parameters
Growth parameter such as leaf area index (LAI) and total dry matter production (TDM) hill-1 were determined at 20, 35, 50 and 65 DAT. Five hills were marked by bamboo stick excluding boarder rows to collect data on plant height and tiller number. Five hills were destructed every sampling dates for LAI and TDM.
The leaf area was measured by an automatic leaf area meter (Type AAN-7, Hayashi Dam Ko Co., Japan). LAI was calculated as the ratio of total leaf area and total ground area of the sample as described by Hunt (1978) and Yoshida (1981).
![]()
Where, LA= Total leaf area of the leaves of all sampled plants (cm2), P= Area of the ground surface covered by the plant (cm2).
To determine TDM, two hills were taken excluding border rows and central 1m × 1m harvest area at 20, 35, 50 and 65 DAT. The roots of each plant were removed, then the plants were washed with tap water and the destructive plant samples were packed in labelled brown paper bags and dried in the oven at 85±5°C for 72 h until constant weight was reached. The samples were weighed carefully after oven drying to measure the dry weight of plant.
Crop growth rate was calculated from the following equation as described by Wolf and Carson (1973):
![]()
Here, W1= Total dry matter hill-1 at time T1, W2= Total dry matter hill-1 at time T2
2.9. Yield Components
2.9.1. Number of Effective Tillers Hill-1
The tillers having a panicle with at least one grain was considered as effective tiller.
![]()
2.9.2. Number of Grains Panicle-1
Presence of any food material in the spikelets was considered as grain and total numbers of grains present on each panicle were counted.
2.9.3. Number of Sterile Spikelets Panicle-1
Spikelets lacking any food material inside were considered as sterile spikelets and such spikelets present on each panicle were counted.
![]()
2.9.4. Weight of 1000 Grains
One thousand clean dried grains were counted from the seed stock obtained from each plot and weighed in gram by using an electrical balance for determining weight of 1000 grains.
2.9.5. Grain Yield
Grains obtained from central 1 m2 area of each unit plot were sun dried and weighed carefully. The dry weight of grains of 1 m2 area was adjusted at 14% moisture content and finally converted to t ha -1.
2.9.6. Straw Yield
Straws obtained from central 1 m2 area of each unit plot were sun dried and weighed carefully. The dry weight of straw of 5 m2 area was finally converted to t ha-1.
2.9.7. Harvest Index (%)
The harvest index is the ratio of grain yield to biological yield expressed as percentage. It was calculated with the following formula.
![]()
2.9.8. Estimation of Protein in Grains
The grain samples were collected from each plot and dried in an oven at 65°C for 24 h after which they were ground by a grinding machine. Later, the ground samples were sieved through a 20 mesh sieve. The prepared samples were then put in polythene bags and in the dessicator until use.
Approximately 10 g grain samples were preserved in polythene bags for chemical analysis to determine total nitrogen content. Chemical analysis was done by Micro-Kjeldahl method (AOAC, 1984) at the Hambolt Laboratory of Soil Science Deparment in Bangladesh Agricultural University, Mymensingh as follows:
One gram sample was digested in 25 mL concentrated H2SO4 in presence of 12-15 g of mixture (CuSO4: K2SO4= 1:5) in a Kjeldahl flask. After the completion of digestion, the flask was cooled, 150 mL distilled water was added, followed by the addition of some glass beads and zinc granules to avoid bumbing. One hundred mL of 40% NaOH solution was then introduced into the flask along the side of the flask carefully avoiding mixing and was immediately distilled. The distillate was collected in 2% boric acid solution in presence of mixed indicator in an Erlenmeyer flask. The distillate was titrated with 0.2 N HCl solution and the amount of nitrogen found in the samples was multiplied by 5.95 to obtain total protein present in the sample. The result was expressed in percentage of grain protein content as calculated by the following formula:
![]()
2.9.9. Statistical Analysis
Data were compiled and tabulated in proper form for statistical analysis. The recorded data on different parameters were analysed with the help of computer package MSTAT-C. The mean differences among the treatments were tested with Duncan’s Multiple Range Test (Gomez and Gomez, 1984).
3. Results
3.1. Effects on Growth Parameters
3.1.1. Leaf Area Index
LAI was significantly influenced by variety, spacing and N-levels except 20 and 65 DAT by spacing and N-levels, respectively (Table 2). The highest LAI was obtained in BRRI dhan49 at all sampling dates. LAI was increased with wider spacing and found highest in spacing 25 cm × 15 cm at all sampling dates except 20 DAT (Table 2). In fertilizer treatment, the highest LAI was found when fertilized with 80 kg N ha-1 except 20 DAT, and the lowest from 0 kg N ha-1 (Table 2). Though the LAI increased slightly with the increase of N-level from 60 to 80 kg N ha-1 after 20 DAT, they are statistically identical. The interaction effect of different varieties, spacing and N-levels had also significant effect on LAI at all sampling dates (Table 3). At final day of measurement i.e. 65 DAT, the highest LAI was obtained in BRRI dhan56 at spacing 25 cm × 15 cm with 80 kg N ha-1, and of the lowest LAI was obtained in BRRI dhan56 at spacing 20 cm × 10 cm with 0 kg N ha-1 (Table 3).
Table 2. Effect of variety, spacing of transplanting and N-levels on LAI, CGR and TDM at different DAT.
| Treatments | Leaf area index (LAI) | Total dry matter (TDM) (g hill-1) | Crop growth rate (CGR) (g day-1 hill-1) | ||||||||
| Days after transplanting (DAT) | Days after transplanting (DAT) | Days after transplanting (DAT) | |||||||||
| 20 | 35 | 50 | 65 | 20 | 35 | 50 | 65 | 20-35 | 35-50 | 50-65 | |
| Variety | |||||||||||
| BR11 | 1.49b | 3.19ab | 6.81a | 6.85b | 1.99b | 7.33b | 14.74b | 23.38 | 3.56 | 4.56b | 5.76b |
| BRRI dhan49 | 1.58a | 3.31a | 6.88a | 7.04a | 2.77a | 9.36ab | 16.52a | 26.28 | 4.39 | 4.78ab | 6.50a |
| BRRI dhan56 | 1.52a | 3.12b | 5.96b | 6.19c | 2.38ab | 9.74a | 16.58a | 26.95 | 4.91 | 4.94a | 6.92a |
| Level of sig. | ** | ** | ** | ** | ** | ** | ** | NS | NS | ** | ** |
| Spacing (cm) | |||||||||||
| 25cm × 15cm | 1.52 | 3.39a | 6.81a | 7.00a | 2.67 | 9.52a | 17.21a | 27.88 | 4.56a | 5.13a | 7.11a |
| 20cm × 10cm | 1.54 | 3.02b | 6.28b | 6.38b | 2.09 | 8.10b | 14.68b | 23.19 | 4.01b | 4.39b | 5.67b |
| Level of sig. | NS | ** | ** | ** | NS | * | ** | NS | * | ** | ** |
| N- levels (kg ha-1) | |||||||||||
| 0 | 1.99b | 7.33b | 14.74b | 23.38 | 1.92c | 7.49c | 13.55c | 20.67 | 3.72 | 4.04 | 4.74c |
| 60 | 2.77a | 9.36ab | 16.52a | 26.28 | 2.31b | 8.39b | 15.83b | 25.83 | 4.05 | 4.96 | 6.66b |
| 80 | 2.38ab | 9.74a | 16.58a | 26.95 | 2.91a | 10.54a | 18.45a | 30.11 | 5.09 | 5.27 | 7.78a |
| Level of sig. | ** | ** | ** | NS | ** | ** | ** | NS | NS | NS | ** |
In a column, figures having same letter(s) or without letter(s) do not differ significantly whereas the figures with dissimilar letter (s) differ significantly as per DMRT. Asterisks indicate a significant difference between control and treatment *p<0.05, **p<0.01 and NS= Not Significant.
Table 3. Interaction effect of variety, spacing of transplanting and N-levels on LAI, CGR and TDM at different DAT.
| Interaction (Variety × Spacing × N-levels) | Leaf area index (LAI) | Total dry matter (TDM) (g hill-1) | Crop growth rate (CGR) (g day-1 hill-1) | ||||||||
| Days after transplanting (DAT) | Days after transplanting (DAT) | Days after transplanting (DAT) | |||||||||
| 20 | 35 | 50 | 65 | 20 | 35 | 50 | 65 | 20-35 | 35-50 | 50-65 | |
| V1× S1× N0 | 1.15d | 1.81h | 5.95h | 5.71e | 1.58hi | 6.24jk | 12.14gh | 17.14k | 3.11f | 3.93efg | 3.33fg |
| V1× S1× N1 | 1.65bc | 3.98bc | 7.53de | 8.01a-d | 2.06fg | 7.13ijk | 15.65de | 25.93fg | 3.38ef | 5.68b | 6.86cde |
| V1× S1× N2 | 1.44c | 3.78cd | 7.95cd | 8.19ab | 2.45c-g | 7.83f-i | 16.09cde | 27.25ef | 3.59ef | 5.51bcd | 7.44bcd |
| V1× S2× N0 | 1.06d | 1.79hi | 4.17j | 3.97fg | 1.35i | 5.97k | 13.40fg | 20.67ij | 3.08f | 4.96b-f | 4.84efg |
| V1× S2× N1 | 2.16a | 4.20ab | 7.94cd | 7.09cd | 2.33d-g | 8.61d-h | 17.00bcd | 27.00efg | 4.18cde | 5.60bc | 6.67cde |
| V1× S2× N2 | 1.49c | 3.55de | 7.29e | 8.13abc | 2.17efg | 8.18e-i | 14.16ef | 22.27hi | 4.01de | 3.98efg | 5.41def |
| V2× S1× N0 | 1.85b | 3.79cd | 6.82f | 7.80bcd | 2.67cde | 8.86d-g | 17.77bc | 29.43cde | 4.13cde | 5.94b | 7.77bc |
| V2× S1× N1 | 1.18d | 3.47ef | 6.44fg | 7.19bcd | 2.86c | 9.84cd | 18.13b | 26.26fg | 4.65cd | 5.53bcd | 5.42def |
| V2× S1× N2 | 1.68bc | 3.29f | 8.43ab | 8.10abc | 4.22a | 12.70b | 21.04a | 34.12b | 5.65b | 5.56bcd | 8.72abc |
| V2× S2× N0 | 1.08d | 1.55ij | 5.30i | 4.98ef | 1.56hi | 7.09ijk | 12.08gh | 16.14k | 3.69ef | 3.33g | 2.71g |
| V2× S2× N1 | 2.09a | 3.98bc | 7.56de | 6.95d | 1.94gh | 7.36hij | 12.83fg | 20.44ij | 3.61ef | 3.65fg | 5.07ef |
| V2× S2× N2 | 1.61bc | 3.77cd | 6.71f | 7.24bcd | 3.40b | 10.31c | 17.27bcd | 31.27c | 4.61cd | 4.64b-e | 9.34ab |
| V3× S1× N0 | 1.00d | 2.45g | 4.23j | 4.12fg | 2.92c | 9.14c-f | 15.38de | 22.37hi | 4.15cde | 4.15c-g | 4.66efg |
| V3× S1× N1 | 1.63bc | 3.68de | 6.13gh | 7.74bcd | 2.53c-f | 9.36cde | 17.15bcd | 31.00cd | 4.56cd | 5.19b-e | 9.23ab |
| V3× S1× N2 | 2.12a | 4.29a | 8.69a | 8.93a | 2.75cd | 14.53a | 21.54a | 37.46a | 7.86a | 7.26a | 10.61a |
| V3× S2× N0 | 1.02d | 1.45j | 4.09j | 3.88g | 1.44i | 7.65ghi | 10.56h | 18.26jk | 4.14cde | 1.94h | 5.13ef |
| V3× S2× N1 | 1.11d | 2.67g | 4.36j | 4.20fg | 2.16efg | 8.04e-i | 14.24ef | 24.32gh | 3.92de | 4.13d-g | 6.72cde |
| V3× S2× N2 | 2.21a | 4.19ab | 8.25bc | 8.25ab | 2.47c-f | 9.71cd | 20.60a | 28.31def | 4.82c | 4.67b-g | 5.14ef |
| CV(%) | 12.15 | 9.93 | 10.29 | 11.29 | 7.41 | 3.89 | 5.07 | 4.05 | 5.05 | 11.43 | 11.01 |
| Level of sig. | ** | ** | ** | ** | * | ** | ** | ** | ** | ** | * |
In a column, figures having same letter(s) or without letter(s) do not differ significantly whereas the figures with dissimilar letter (s) differ significantly as per DMRT. Asterisks indicate a significant difference among the treatments *p<0.05, **p<0.01 and NS= Not Significant. Here, V1= BR11, V2= BRRI dhan49 and V3= BRRI dhan56, S1= 25cm × 15cm and S2= 20cm × 10cm, N0= 0 kg N ha-1, N1= 60 kg N ha-1 and N2= 80 kg N ha-1.
3.1.2. Total Dry Matter
Significant effect of variety, spacing and N-levels on TDM production hill-1was observed in all measurements time except 65 DAT of all and 20 DAT of spacing (Table 2). The highest TDM obtained by BRRI dhan56 at all sampling dates except 20 DAT which was satatistically identical to BRRI dhan49, and the lowest one was produced by BR11. Similar to LAI, TDM content was also increased with wider spacing and found highest in the spacing 25 cm × 15 cm at all sampling dates (Table 2). On the other hand, TDM production increased gradually with increase of N-levels. The highest TDM was obtained when fertilized with 80 kg N ha-1 and the lowest one was obtained in 0 kg N ha-1. The interaction effect of variety, spacing and N-levels on TDM had significant effect at all sampling dates (Table 3). At final date of measurement (65 DAT), the highest TDM was observed in BRRI dhan56 at spacing 25 cm × 15 cm with application of 80 kg N ha-1. On the same date of measurement, the lowest one was in BRRI dhan49 at spacing 20 cm × 10 cm without N-application (0 kg N ha-1).
3.1.3. Crop Growth Rate
The effects of variety and spacing on CGR were significant at all DAT except at 20-35 DAT for variety, and for N-levels it was significant only at 50-65 DAT. (Table 2). At 50-65 DAT, the highest CGR was obtained in BRRI dhan56 which was satatistically identical to BRRI dhan49, and the lowest CGR was obtained in BR11 (Table 2). At same DAT, the highest CGR was obtained in the wider spacing 25 cm × 15 cm and highest dose of N application (80 kg N ha-1). On the other hand, lowest CGR was obtained in the closer spacing 20 cm × 10 cm and with 0 kg N ha-1 application. The interaction effect of variety, spacing and N-levels on CGR had significant effect at all sampling dates (Table 3). The highest CGR was found in BRRI dhan56 at spacing 25 cm × 15 cm with application of 80 kg N ha-1 at all samping dates. But the lowest CGR found in different combinations, which varied among the sampling dates (Table 3).
3.2. Effects on Yield Contributing Characters and Yield
3.2.1. Number of Effective Tillers Hill-1
Variety and N-levels have significant effect on the number of effective tillers hill-1. However, the effect of spacing on effetive tillers hill-1 was not significant. The highest number of effective tillers hill-1 was found in BRRI dhan49, which was statistically identical to the BRRI dhan56, and lowest one was obtained from variety BR11 (Table 4). The highest number of effective tillers hill-1 was obtained when 80 kg N ha-1 was applied and the lowest one from 0 kg N ha-1. The interaction effect of variety, spacing and N-levels on number of effective tillers hill-1 were found significant (Table 5). The highest number of effective tillers were observed in interaction of BRRI dhan49 with 25 cm × 15 cm spacing and 80 kg N ha-1, and the lowest number of effective tillers hill-1 were recorded in interaction of BR11 with closer spacing 20 cm × 10 cm and 0 kg N ha-1.
3.2.2. Panicle Length
Except spacing, all other treatments and their interactions have no significant effect on panicle length (Table 4 and 5). The highest panicle length was found in wider spacing.
3.2.3. Number of Grains Panicle-1
Except spacing, all other treatments and their interactions have significant effect on number of grains panicle-1 (Table 4 and 5). BRRI dhan49 produced the highest number of grains panicle-1 followed by BRRI dhan56 and the lowest one was recorded in BR11. The highest number of grains panicle-1 was found in application of 80 kg N ha-1 followed by application of 60 kg N ha-1 and the lowest one was found in 0 kg N ha-1. The highest number of grains panicle-1 was recorded in the interaction of BRRI dhan49 with spacing 20 cm × 10 cm and 80 kg N ha-1, and the lowest one was in BRRI dhan56 with spacing 20 cm ×10 cm and application of 60 kg N ha-1.
3.2.4. Number of Sterile Spikelets Panicle-1
All the treatments (variety, spacing and N-levels) and their interactions have significant effect on number of sterile spikelets panicle-1 (Table 4 and 5). The highest number of sterile spikelets panicle-1 was observed in BR11 and the lowest one was in BRRI dhan49. The dense spacing (20 cm × 10 cm) produced the highest number of sterile spikelets panicle-1, than the wider spacing (25 cm × 15 cm). The highest numbers of sterile spikelets panicle-1 was observed in 0 kg N ha-1 and the lowest one was in 80 kg N ha-1. The interactions of BR11 with spacing 20 cm × 10 cm and 0 kg N ha-1 gave the highest number of sterile spikelets panicle-1, but the lowest one was in BRRI dhan56 with 25 cm × 15 cm spacing and application of 60 kg N ha-1.
3.2.5. Sterility Percentage of Grains
Similar to number of sterile spikelets panicle-1, all the treatments (variety, spacing and N-levels) and their interactions have significant effect on sterility percentage of grains (Table 4 and 5). The highest sterility percentage was observed in BR11, and the lowest one was in BRRI dhan49. On the other hand, 20 cm × 10 cm spacing and 0 kg N ha-1 fertilizer treatments gives the highest sterility percentage of grains, that of the lowest was observed at 20 cm × 10 cm spacing and 80 kg N ha-1 (Table 4). The highest sterility percentage of grains was recorded in the interaction of BR11 with spacing 20 cm × 10 cm and 0 kg N ha-1, and the lowest one was in BRRI dhan56 with 25 cm ×15 cm spacing and application of 60 kg N ha-1 (Table 5).
3.2.6. Weight of 1000 Grains
Variety differed significantly among themselves regarding weight of 1000 grains (Table 4). The result revealed that the highest weight of 1000 grains was produced by BR11 and the lowest one was recorded in BRRI dhan49. Spacing also has significant effect on 1000 grains weight, and the highest 1000 grains weight was observed in wider spacing (25 cm × 15cm) (Table 4). Different N-levels, and the interaction effects of all treatments have no significant effect on weight of 1000 grains (Table 4 and 5).
3.2.7. Grain Yield
All the treatments and their interactions have significant effect on grain yield (Table 4 and 5). From the results, it is evident that among three varieties, BRRI dhan49 gave the highest grain yield (4.57 t ha-1), however this value was statistically identical to the grain yield of BR11 (4.54 t ha-1). The highest grain yield of BRRI dhan49 is due to the contribution of highest number of effective tillers hill-1 and numbers of grains paincle-1. On the other hand, the higher grain yield of BR 11 is mainly because of its highest weight of 1000-grains (Table 4). Closer spacing showed lower grain yield while the wider spacing showed higher grain yield. Grain yield increased gradually with increasing N-levels. The highest grain yield was found when fertilized with 80 kg N ha-1 and the lowest from 0 kg N ha-1. Grain yield was also significantly affected by the interaction effect of variety, spacing and nitrogen level (Table 5). The highest grain yield was recorded in the interaction of BRRI dhan49 with spacing 25 cm × 15 cm and application of 80 kg N ha-1, which was statistically identical to the combination of BRRI dhan56 with spacing 20 cm × 10 cm and 80 kg N ha-1; BR11 with spacing 25 cm × 15 cm and 80 kg N ha-1; BRRI dhan49 with spacing 20 cm × 10 cm and 80 kg N ha-1; BRRI dhan56 with spacing 25 cm × 15 cm and 80 kg N ha-1; and BRRI dhan56 with spacing 25 cm × 15 cm and 60 kg N ha-1. The lowest one was obtained in the interaction effect of BRRI dhan56 with spacing 20 cm × 10 cm and 0 kg N ha-1, which was statitically identical to BRRI dhan56 with spacing 25 cm × 15 cm and 0 kg N ha-1.
3.2.8. Straw Yield
Variety had no significant effect on straw yield (Table 4). Plant spacings and N-levels have significant effect on straw yield (Table 4). The highest straw yield was obtained from the wider spacing and the highest N application. There is no significant interactions effect of variety, spacing and N-levels on the straw yield (Table 5).
3.2.9. Harvest Index
Harvest index was only influenced significantly by N-levels (Table 4 and 5). The range of harvest index was found from 43.76% to 47.35%. The highest harvest index was observed when fertilized with 80 kg N ha-1, and the lowest one was in 0 kg N ha-1.
3.2.10. Grain Protein Content
The variation in grain protein content was significant due to variety and N-levels (Table 4), which ranged from 7.96% to 8.24%. The highest grain protein content was recorded in BR11 and lowest one was recorded in variety BRRI dhan56. The higher dose of N application (80 kg N ha-1) produced the highest grain protein content while the lowest one was observed in application of 0 kg N ha-1. There was significant effect of the interactions of variety, spacing and N-levels on grain protein content (Table 5). The highest grain protein content was recorded in the BR11 with spacing 20 cm × 10 cm and application of 80 kg N ha-1, however this value was statistically identical with other varieties when subjected to highest dose N-fertilizer application (80 kg N ha-1) irrespective of spacing. The lowest one was recorded in the BRRI dhan49 with spacing 20 cm × 10 cm and 0 kg N ha-1.
Table 4. Effect of variety, spacing of transplanting and N-levels on yield contributing characters and yield of transplant aman rice.
| Treatments | Number of effective tillers hill-1 | Panicle length (cm) | Number of grains panicle-1 | Number of sterile spikelets panicle-1 | Sterility percentage of grain | Weight of 1000 grains (g) | Grain yield (t ha-1) | Straw yield (t ha-1) | Harvest index (%) | Protein content (%) |
| Variety | ||||||||||
| BR11 | 4.85b | 22.83 | 97.87c | 20.49a | 17.02a | 27.14a | 4.54a | 5.28 | 46.17 | 8.24a |
| BRRI dhan49 | 8.38a | 21.95 | 111.96a | 11.80c | 9.62c | 18.34c | 4.57a | 5.33 | 46.05 | 8.00b |
| BRRI dhan56 | 7.43a | 22.68 | 105.88b | 12.53b | 10.74b | 22.88b | 4.34b | 5.46 | 44.06 | 7.96c |
| Level of sig. | ** | NS | ** | ** | ** | ** | ** | NS | NS | ** |
| Spacing (cm) | ||||||||||
| 25cm × 15cm | 7.56 | 22.66a | 108.99 | 13.41b | 11.01b | 22.89a | 4.62a | 5.61a | 45.04 | 8.04 |
| 20cm × 10cm | 6.21 | 22.31b | 101.48 | 16.46a | 13.91a | 22.69b | 4.35b | 5.11b | 45.82 | 8.09 |
| Level of sig. | NS | * | NS | * | ** | ** | * | * | NS | NS |
| N-levels (kg ha-1) | ||||||||||
| 0 | 4.61c | 22.42 | 96.75c | 16.81a | 14.40a | 22.85 | 3.65c | 4.68b | 43.76c | 7.00c |
| 60 | 7.01b | 22.57 | 102.58b | 14.41b | 12.29b | 22.69 | 4.63b | 5.62a | 45.18b | 8.24b |
| 80 | 9.03a | 22.47 | 116.37a | 13.59c | 10.69c | 22.82 | 5.17a | 5.77a | 47.35a | 8.97a |
| Level of sig. | ** | NS | ** | ** | ** | NS | ** | * | ** | ** |
In a column, figures having same letter(s) or without letter(s) do not differ significantly whereas the figures with dissimilar letter (s) differ significantly as per DMRT. Asterisks indicate a significant difference among the treatments *p<0.05, **p<0.01 and NS= Not Significant.
Table 5. Interaction effect of variety, spacing of transplanting and N-levels on yield contributing characters and yield of transplant aman rice.
| Interaction (Variety × Spacing × N-levels | Number of effective tillers hill-1 | Panicle length (cm) | Number of grains panicle-1 | Number of sterile spikelets panicle-1 | Sterility percentage of grain | Weight of 1000 grains (g) | Grain yield (t ha-1) | Straw yield (t ha-1) | Harvest index (%) | Protein content (%) |
| V1× S1× N0 | 3.38i | 21.33 | 100.45efg | 23.04ab | 18.63b | 27.41 | 4.25de | 5.20 | 44.99 | 7.20bcd |
| V1× S1× N1 | 5.21gh | 22.83 | 99.17fg | 25.57a | 20.49ab | 27.31 | 4.48cde | 5.40 | 45.40 | 8.40abc |
| V1× S1× N2 | 6.22efg | 22.77 | 102.46ef | 12.10de | 10.56e-h | 27.05 | 5.34ab | 6.24 | 46.10 | 9.00a |
| V1× S2× N0 | 2.10j | 22.27 | 97.26g | 27.20a | 21.81a | 26.89 | 3.53fg | 4.33 | 44.90 | 7.19cd |
| V1× S2× N1 | 5.60fgh | 23.18 | 85.40i | 12.10de | 12.40def | 26.88 | 4.65cde | 5.20 | 47.16 | 8.60ab |
| V1× S2× N2 | 6.58ef | 22.83 | 102.46ef | 22.90ab | 18.24bc | 27.31 | 4.96abc | 5.28 | 48.47 | 9.05a |
| V2× S1× N0 | 6.13efg | 23.00 | 92.33h | 11.08e | 10.66efg | 18.14 | 4.12ef | 5.17 | 44.33 | 6.95cd |
| V2× S1× N1 | 9.79bc | 21.40 | 116.22d | 10.53e | 8.31ghi | 18.28 | 4.76b-e | 5.48 | 46.47 | 8.10a-d |
| V2× S1× N2 | 13.00a | 22.17 | 120.63c | 9.53e | 7.32hi | 18.86 | 5.51a | 6.07 | 47.56 | 8.91a |
| V2× S2× N0 | 4.42hi | 21.53 | 87.62i | 10.60e | 10.80efg | 18.50 | 3.57fg | 4.38 | 44.88 | 6.85d |
| V2× S2× N1 | 7.00e | 22.27 | 116.90d | 18.43bc | 13.48de | 18.14 | 4.53cde | 5.58 | 44.81 | 8.25a-d |
| V2× S2× N2 | 9.94b | 23.10 | 138.05a | 10.62e | 7.14i | 18.14 | 4.95abc | 5.31 | 48.26 | 8.95a |
| V3× S1× N0 | 6.26efg | 22.03 | 99.24fg | 9.93e | 9.09f-i | 23.47 | 3.26g | 4.67 | 41.09 | 6.90d |
| V3× S1× N1 | 8.23d | 22.83 | 116.58d | 8.57e | 6.85i | 22.75 | 4.91a-d | 6.06 | 44.82 | 8.01a-d |
| V3× S1× N2 | 9.79bc | 23.83 | 133.79b | 10.35e | 7.18i | 22.71 | 4.94abc | 6.16 | 44.57 | 8.92a |
| V3× S2× N0 | 5.37fgh | 23.50 | 103.61e | 19.00bc | 15.39cd | 22.70 | 3.17g | 4.32 | 42.35 | 6.92d |
| V3× S2× N1 | 6.25efg | 22.03 | 81.23j | 11.27de | 12.21def | 22.80 | 4.42cde | 6.00 | 42.41 | 8.05a-d |
| V3× S2× N2 | 8.67cd | 21.87 | 100.82efg | 16.03cd | 13.71de | 22.87 | 5.33ab | 5.57 | 49.11 | 8.96a |
| CV(%) | 12.27 | 6.98 | 4.77 | 15.52 | 14.40 | 3.7 | 9.31 | 10.88 | 7.08 | 8.08 |
| Level of sig. | ** | NS | ** | ** | ** | NS | ** | NS | NS | ** |
In a column, figures having same letter(s) or without letter(s) do not differ significantly whereas the figures with dissimilar letter (s) differ significantly as per DMRT. Asterisks indicate a significant difference among the treatments **p<0.01 and NS= Not Significant. Here, V1= BR11, V2= BRRI dhan49 and V3= BRRI dhan56, S1= 25cm × 15cm and S2= 20cm × 10cm, N0= 0 kg N ha-1, N1= 60 kg N ha-1 and N2= 80 kg N ha-1.
4. Relationships of Leaf Area Index and Total Dry Matter with Grain Yield
LAI and TDM are important characters responsible for higher grain yield. Relationships of LAI and TDM with grain yield were significantly positively correlated (r = 0.846** and 0.687** for LAI and TDM; respectively) at 65 DAT (Figure 1 and 2). This means an increase in LAI and TDM will result in corresponding increase in grain yield of those three varieties of rice.
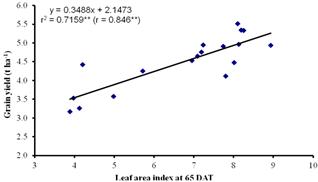
Figure 1. Relationship between leaf area index and grain yield of transplant aman rice at 65 days after transplanting.
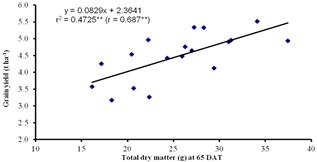
Figure 2. Relationship between total dry matter and grain yield of transplant aman rice at 65 days after transplanting.
5. Discussion
In the present research we observed highest growth (LAI, TDM, CGR) and yield contributing (panicle length, weight of 1000-grain) parameters in wider spacing (25cm × 15cm) compare to closer spacing (20cm × 10cm). In agreement with this, the lowest number of sterile spikelets panicle-1and sterility percentage of grain was observed in wider spacing than closer. As LAI, TDM and CGR had positive correlation with grain yield, the highest grain yield was also obtained in wider spacing. In case of wider spacing, the plant density helped the plants to capture more sunlight and to accumulate more biomass (Mohaddesi et al. 2011) because of less mutual shading effect and less competition (Oad et al. 2001) for nutrients and water uptake, which lead to greater TDM hill-1 and CGR. These maximum LAI, TDM and CGR were also contributed to get the highest grain yield.
N plays an important role in growth, yield and quality of rice. In this experiment highest dose of N (80 kg N ha-1) gave the highest LAI, TDM, CGR, number of effective tillers hill-1 and number of grains panicle-1, and lowest number of sterile spikelets panicle-1and sterility percentage of grain. The higher value of these parameters results in the highest grain yields, straw yield and harvest index. In addition, highest protein content was also observed when 80 kg N ha-1 was applied. It has been reported earlier that N application up to panicle initiation stage increase protein content and possibly grain yield of rice (Patrick and Hoskins 1974; Perez et al. 1996). As stated earlier protein content of rice grain is important for human body especially in South East Asia. In these areas, rice accounts for the major supplier of daily calories and protein intake. For example, in Bangladesh, Vietnam, and Myanmar, rice accounts for two-thirds or more of caloric intake and approximately 60% of daily protein consumption. Whereas, in Thailand and Indonesia, rice still accounts for nearly 50% of calories and one-third or more of protein. Hossain et al. (2010) conducted experiment with five aman rice varieties (BRRI dhan30, BRRI dhan32, BRRI dhan34, BRRI dhan39 and Naizershail) and obtained highest protein content in BRRI dhan34 with 80 kg N ha-1. In our experiment highest grain protein content was observed in variety BR11 with 80 kg N ha-1. The findings suggest that 80 kg N ha-1 may have the potential to increase the grain protein content of some aman varieties.
Among the three rice varieties, BRRI dhan49 gave the highest grain yield. This is because of highest LAI, TDM, CGR, number of effective tillers hill-1 and number of grains pancle-1, and lowest number of sterile spikelets panicle-1 and sterility percentage of grain produced by BRRI dhan49. Grain yield differences among the three varieties may be due to their variant genetic make-up.
6. Conclusions
In this experiment BRRI dhan49 in combination with 25 cm × 15 cm spacing and application of 80 kg N ha-1 gave the highest grain yield as well as higher protein content. As increasing rice yield is the main goal for rice based developing country to feed the increased population. Therefore, these management combinations appears most effetive practice for maximizing the grain yield of aman rice especially for the variety BRRI dhan49; considering the soil and climatic condition.
References
- AOAC. 1984. Official methods of analysis. Association of official agriculture chemists. Washington, D. C.
- Bufogle, A., P. K. Bollich, R. J. Norman, J. L. Kovar, C. W. Lindau and R. E. Macchiavelli. 1997. Rice plant growth and nitrogen accumulation in drill-seeded and water-seeded culture. Soil Sci. Soc. Am. J. 61:832-839.
- Chandel, G., S. Banerjee, S. See, R. Meena, D. J. Sharma and S. B. Verulkar. 2010. Effect of different nitrogen fertilizer levels and native soil properties on rice grain Fe, Zn and protein contents.Rice Sci. 17: 213-227.
- Eggum, B. O. 1975. Biological availability of amino acid constituents in grain protein. Nuclear Techniques for plant protein improvement (Proc. Meeting, Neuherberg, 1972), JAEA, Vienna, 193.
- FAO-UNDP (Food and Agriculture Organization-United Nations Development Programme). 1988. Land resources appraisal of Bangladesh for agricultural development. Agro-ecological regions of Bangladesh, BGD/81/035. Technical Report No. 2, FAO, Rome, Italy.
- Gomez, K. A. and A. A. Gomez. 1984. Statistical Procedure for Agricultural Research, John Willey and Sons, New York, NY, USA, 2nd edition.
- Gozubenli, H. 2010. Influence of planting pattern and plant density on the performance of maize hybrids in the eastern Mediterranean condition. Int. J. Agric. Biol. 12: 556–560.
- Hossain, M. S., F. I. Monshi, A. M. A. Kamal and M. F. Miah. 2010. Grain yield and protein content of transplant aman rice as influenced by variety and rate of nitrogen.J. Agrofor. Environ. 3: 235-238.
- Hunt, R. 1978. Plant Growth Analysis Studies in Biology. Edward Arnold Ltd., London. p 67–71.
- Hussain, S. G. 2012. Role of Rice in Food Security of Bangladesh (Chapter 5). In:Jones, M. A. and Hernandez, F. E. (Eds.). Food Security: Quality Management, Issues and Economic Implications. Nova Science Publishers.p 127-148.
- IRRI (International Rice Research Institute). 1997. Rice Production Manual, UPLB, Los Banos, The Philippines.
- Islam, A. K. M. M., M. A. R. Sarkar and N. Islam. 2007.Effect of spacing and nutrient management in SRI method on the yield components and yield of transplant aman rice. Bangladesh J. Crop Sci. 18:1-6.
- Islam, A. K. M. M., M. Van Meirvenne and M. M. Islam. 2011. Proximal soil sensing system for paddy field variability mapping: the potential of a proximal soil sensor for soil properties mapping. Saarbrücken, Germany: VDM Verlag Dr. Müller.
- Jongkaewwattana, S., S. Geng, D. M. Brandon and J. E. Hill. 1993. Effect of nitrogen and harvest grain moisture on head riceyield. Agron. J. 85:1143-1146.
- Juliano, B. O., A. A. Antonio and B. V. Esmama.1973. Effect of protein content on the distribution and properties of rice protein. J. Sci. Food Agric. 24: 295-306.
- Kandil, A. A., S. E. El-Kalla, A. T. Badawi and O. M. El-Shayb. 2010. Effect of hill spacing, nitrogen levels and harvest date on rice productivity and grain quality. Crop Environ. 1: 22–26.
- Khan, M. B., T. A. Yasir and M. Aman. 2005. Growth and yield comparison of different linseed genotypes planted at different row spacing. Int. J. Agric. Biol. 7: 515–517.
- Khatab, K. A., E. A. M. Osman and A. A. EL- Masry. 2013. Rice productivity and its inner quality as affected by anhydrous ammonia rates with foliar application of organic acids. Adv. Appl. Sci. Res. 4:165-173.
- Maqsood, M., M. A. Shehzad, S. N. A. Ali and M. Iqbal. 2013. Rice cultures and nitrogen rate effects on yield and quality of rice (Oryza sativa L.). Turk. J. Agric. For. 37: 665-673.
- Matsuo, J. 1952. Genecological studies on cultivated rice. Bull. Natl. Inst. Agr. Sci. Japan Ser. D. 3: 1-111.
- Mohaddesi, A., A. Abbasian, S. Bakhshipour and H. Aminpanah. 2011. Effect of different levels of nitrogen and plant spacing on yield, yield components and physiological indices in high yield rice. Amer-Eur. J. Agric Environ. 10: 893-900.
- Mondal, M. M. A., A. B. Puteh, M. R. Ismail and M. Y. Rafii. 2013. Optimizing plant spacing for modern rice varieties. Int. J. Agric. Biol. 15: 175-178.
- Moradi, M. and E. Azarpour. 2011. Determination of most important part of yield components by Path Analysis in Corn. J. Am. Sci. 7: 646-650.
- Norman, R. J., D. Guindo, B. R. Wells, C. E. Wilson Jr. 1992. Seasonal accumulation and partitioning of nitrogen-15 in rice. Soil Sci. Soc. Am. J. 56:1521-1526.
- Oad, F. C., B. K. Solangi, M. A. Samo, A. A. Lakho, Z. U. Hassan and N. L. Oad. 2001. Growth, yield and relationship of rapeseed under different row spacing. Int. J. Agric. Biol. 3: 475–476.
- Patrick, R. M. and F. H. Hoskins.1974. Protein and amino acid content of rice as affected by application of nitrogen fertilizer. Cereal Chem. 51: 84-95.
- Perez, C. M., B. O. Juliano, S. P. Liboon, J. M. Alcantara and K. G. Cassman.1996. Effects of late nitrogen fertilizer application on head rice yield, protein content, and grain quality of rice. Cereal Chem. 73: 556-560.
- Thawait, D., A. K. Patel, S. Kar, M. K. Sharma and M. R. Meshram. 2014. Performance of transplanted scented rice (Oryza sativa L.) under SRI based cultivation practices; a sustainable method for crop production. The Bioscan. 9: 539-542.
- Uddin, M. H. 2003. Effect of plant spacing and nitrogen levels on yield of transplanted Aman rice cv. BR39. MS Thesis, Dept. Agron. Bangladesh Agril. Univ., Mymensingh. p. 16-44.
- Wang, D., S. Chen, Z. Wang, C. Ji, C. Xu, X. Zhang and B. S. Chauhan. 2014. Optimizing hill seeding density for high-yielding hybrid rice in a single rice cropping system in South China. PLoS One. 9: 1-14.
- Wang, D., X. Zhang, C. Zhou, G. Zheng, G. Zhang, X. XU, B. Jin, W. Zhang, H. Chen and J. Li. 2010. Grain yield difference investigation and reasonable planting density analysis of rice production in Zhejiang Province. Acta Agriculturae Zhejiangensis, 22: 330–336 (in Chinese with English abstract).
- Wolf, D. D. and E. W. 1973. Growth analysis. J. Agron. Edu. 2: 39-42.
- Yoshida, S. 1981. Physiological Analysis of Rice Yield. In: Fundamentals of rice crop science. Intl. Rice Res. Ins., Los Banos, Phillippines.


