
Agricultural and Biological Sciences Journal, Vol. 1, No. 2, April 2015 Publish Date: Mar. 21, 2015 Pages: 16-26
Genetic Characterization of Lentil (Lens culinaris L.) Germplasm by Using SSR Markers
U. K. S. Kushwaha1, *, S. K. Ghimire1, N. K. Yadav2, B. R. Ojha1, R. K. Niroula3
1Institute of Agriculture and Animal Science, Department of Plant Breeding, Tribhuvan University, Rampur, Chitwan, Nepal
2Nepal Agricultural Research Council, Singh Darbar, Kathmandu, Nepal
3Nepal Agricultural Research Council, Biotechnology Unit, Khumaltar, Lalitpur
Abstract
Ninety six lentil accessions were collected from National Grain Legume Research Program, Rampur; Regional Agriculture Research Station, Nepalgunj and National Agriculture Genetic Resource Center, Khumaltar, Lalitpur.Among them; four lines were Nepal Local, forty two lines were Nepal Cross; forty seven lines were ICARDA Line and finally three lines were Indian Line. Allaccessions were analysed by DNA fingerprinting using thirty three selected polymorphic SSR markers. The characterization was performed in Biotechnology Unit, Nepal Agricultural Research Council, Khumaltar, Lalitpurin 2012 by using standard protocols. The dendrogram constructed based on Jaccard’s similarity coefficient and UPGMA separated all accessions into four clusters with two major groups. Group A consisted of three cluster (I, II and III) whereas Group B comprised only one cluster (IV). Cluster I represented 58.33 % of total genotypes followed by cluster II (38.54%), cluster III (2.08 %) and cluster IV (1.04 %). Cluster I was the largest and cluster IV was the smallest cluster based on number of genotypes. Microsatellite profiling based dendrogram revealed that RL lines were more diverged than ILL lines. Among all lentil accessions Sagun and LN 0135 showed distant relationship as compared to others in dendrogram. The first three Eigen values of three principal coordinate axes explained 71.08 % genetic variation and the first two principal axes accounted for 53.76 % of total variation describing ninety six genotypes. The clustering pattern obtained coincided with the apparent grouping patterns performed by PCA. So the results obtained through PCA were confirmed by non-hierarchical clustering. All the accessions included in the study displayed significant amount of genetic variability due to different center of origin and different genetic constitutions. The diversity detected in this study may constitute the new materials for future systematic lentil breeding programs.
Keywords
Lentil, Genotypes, Diversity, Cluster, Marker
Received: February 16, 2015
Accepted: March 11, 2015
Published online: March 20, 2015
@ 2015 The Authors. Published by American Institute of Science. This Open Access article is under the CC BY-NC license. http://creativecommons.org/licenses/by-nc/4.0/
Contents
1. Introduction 2. Materials and Methods 2.1. Collection of Lentil Germplasm 2.2. Plant Materials 2.3. Microsatellite Marker 2.4. Characterization of Germplasm 2.5. Genetic Characterization byDNA Fingerprinting Using SSR Marker 2.6. ModifiedCTAB Method for Lentil DNA Isolation/Extraction 2.7. DNA Quantification 2.8. PCR Amplification 2.9. Agarose Gel Preparation 2.10. Preparation of Lodging Sample 2.11. Autoradiography/Fingerprinting 2.12. Band Scoring 2.13. Statistical Analysis 2.14. Cluster Analysis 2.15. Polymorphic Information Content (PIC) 3. Results and Discussion 3.1. Multivariate Analysis 3.2. Polymorphic Information Content 4. Summary and Conclusion
1. Introduction
Genetic variability is a pre-requisite for anycrop improvement programme. The knowledge of geneticdiversity and association of characters with yield is ofgreat importance to the breeder for making animprovement of qualitative characters which generally show little response to direct selection. Genetic diversity assessment with different methods and their comparison could providecomplementary information for improvement and conservation programs. DNAbasedmarkers provide powerful and reliable tools fordiscerning variations within crop germplasm and forstudying evolutionary relationships (Virk et al., 1995). Molecular markershave been used for estimating genetic variation atpopulation level and among closely related species (Nienhuis et al., 1995). Analysis of genetic diversity of germplasm collections can facilitate reliable classification of accessions, and identification of subsets of core accessions with possible utility for specific breeding purposes.Several classes of molecular markershave been developed showing that lentil hasrelatively low levels of genetic variation (Eujayl et al., 1997; Sonnante and Pignone, 2001).Plant descriptors coupled with molecular markers provide a valid evidence of diversity as these are least affected by environmental fluctuations (Ahmad et al., 1997; Jha and Ohri, 1996; Margale et al., 1995).
Lentil (Lens culinaris Medik.subsp. culinaris) is an importantprincipal cool season pulse crop of the Indian Subcontinent, the Middle East, North America, North Africa and West Asia (Erskine, 1996). It is an old world legume and is probably one of the first plant species to be domesticated (Bahl et al., 1993).This crop has the ability to grow under water stress conditions and survive under high range of drought and cold (Cubero, 1981);that are the main attributes which make this an important and unique crop (Savage, 1988; Bhatty, 1998). Nutritionist rank lentil as an excellent source of nutrition which is a major source of complex carbohydrates, proteins, fibers, vitamins A and B, potassium and iron; and low in sodium and fat that regulate growth and development (Anonymous, 2003). It is the nitrogen sequestrating plant that improves soil fertility by fixing atmospheric nitrogen and therefore increases sustainability of agricultural production systems. Nepal has altogether 1,87,437 ha area with 1,51,758 metric ton productivity and 810 kg yield per hectare (MoAD, 2011).
Lentil is a principal pulse crop of Nepal. Yet, the yield and productivity of this crop is not satisfactory. Many varieties released here are not suitable accordance with its agroecological climate. Farmer’s losses a huge amount of crop yield due to severe diseases such as lentil wilt, lentil rust, and stemphylium blight.A lot of lentil land races, primitive races, indigenous races and wild races are still available in Nepal but they have not been studied properly. Compared to other crops; the genetic diversity of lentil based on molecular level has not been studied yet in Nepal. There is lack of breeding approaches for lentil breeding in Nepal.
Thus, there is an urgent need to increase the overall production and productivity of this crop through varietal improvement and suitable agronomic practices under rice-maize cropping systems in Nepal. Before initiation of lentil breeding activities there is urgent need to characterize, evaluate lentil germplasm available to us.In order to address this goal, characterization and evaluation of available lentil accessions is extremely necessary. Therefore present study was conducted with an objective of selecting divergent parents based on genetic distance for future lentil breeding programme.
2. Materials and Methods
2.1. Collection of Lentil Germplasm
Diverse lentil germplasm were collected from NGLRP, Rampur; RARS, Nepalgunj and NAGRC, Khumaltar. Collected accessions comprised fourNepalese native/local line (Nepal Local): pop1;forty twoNGLRP, Rampur crossed (Nepal Cross):pop2;forty sevenICARDA (ICARDA Line): pop3; and threefrom India (Indian Line): pop4. The list of the collected germplasm is given in table1.
2.2. Plant Materials
Collected seeds of each sample were sown in earthen pot containing five kg of well fertilized soil and grown in glasshouse until maturity with standard agronomic practices. In each pot five plants were maintained.
2.3. Microsatellite Marker
A total of 33 polymorphic microsatellite markers were selected based on the results of previous report (Hamwieh et al., 2005, 2009). These SSR markers were synthesized at 20 nM scale and purchased from Bioneer Company (South Korea). Primers were diluted following manufacturer protocol. The list of polymorphic markers, their name, sequence information, motif, annealing temperature and amplification size are given in Table 2.
2.4. Characterization of Germplasm
All the collected lentil accessions were used for genetic characterization.DNA fingerprinting was conducted with SSR markers. These characterizations wereperformed in Biotechnology unit, Nepal Agricultural Research Council, Khumaltar, Lalitpur.
2.5. Genetic Characterization byDNA Fingerprinting Using SSR Marker
Lentil DNA extraction was done by Modified CTAB method (Doyle and Doyle, 1987) using standard protocol followed by DNA quantification, PCR amplification, gel separation and scoring of gel separated bands using standard protocol. Thirty three polymorphic SSR primers were used in PCR amplification. These markers were selected on the basis of previous report of Hemwieh et al., 2009.
2.6. ModifiedCTAB Method for Lentil DNA Isolation/Extraction
DNA was extracted from one month old seedlings. Young leaves from each five individual plants were pooled and placed on an ice box. Samples were sterilized with 70% ethanol in the laboratory and absorbed extra ethanol with clean tissue paper. About 200-250 mg of fresh leaf tissue were taken, freezed in liquid nitrogen and grounded into a fine powder using a mortar and pestle (powder should not form ice).The DNA was extracted using modified cetyltrimethyl ammonium bromide (CTAB) method. Fine powder was transferred into a micro tube (2.5 µl) and added 600 µl preheated 2˟CTAB (650C). Then the tube was vortexed for a few seconds and incubated at 650 C for 10 minutes (water bath). After that incubation, 600 µl of chloroform /isoamyl alcohol (24:1) was added and shaked vigorously. The extract was centrifusedat 15000 g for 10 minutes and transfered the supernant to a new micro tube. Repeatation of the chloroform/ isoamyl alcohol extraction step for two times more were done. Finally 1 ml 100% ethanol was added to final supernant (DNA fibre become visible upon gentle swirling). DNA was transferred into new tubes and rinse twice with 70 % ethanol. Now resulting DNA pellets was dissolved with 50-100 µl (60 µl) 0.1 TE buffer solution containing 0.001 µgl RNA SeA.The concentration of the DNA was estimated by comparing with known concentration of 100 bp DNA ladder (Genetix, Biotech Asia Pvt. Ltd.).
2.7. DNA Quantification
Before PCR and after DNA extraction the yield of each extracted DNA was also measured using UV-spectrophotometerat absorbance 260 nm. The purity of DNA was also determined by calculating the ratio of absorbance at 260 nm to that of 280 nm (Sambrook et al., 1989).The DNA concentration was determined by using the standard formula: DNA concentration= OD x 50 µg/ml x dilution factor (Linacero et al., 1998).
2.8. PCR Amplification
PCR reaction were conducted in 10 µl volume containing 100 µg of genomic DNA, 10 ng of each primer,5 µl of 2*Go Taq Green PCR master mix (Promega Corporation, Madison, WI, USA) and required amount of PCR H2O to make final volume 10 ul. The reaction mixture without template DNA (8 µl) were dispensed in each 96 wells round bottom plate. Finally the DNA template from respective lentil accessions were added in PCR plate. PCR mixture were amplified in a MJ Research PTC-100TMProgrammable Thermal Controller (MJ Research, Inc., Watertown, MA, USA) with the following temperature regimes; initial denaturation for 2 minutes at 95oC followed by 30 cycles of 95o C for 30 seconds, annealing at 51-56o C depending on the primer melting temperature (TM) for one minutes, extension at 72oC for 1 minutes and final extension at 72oC for 7 minutes followed by holding at 4o C for ∞ time.
2.9. Agarose Gel Preparation
3 gm agarose dissolved in 200 ml 0.5 TBE solution. It was shaked well and melted till appeared crystal transparent in the oven. After that cooled for a few seconds and added 1-2 drops of AgBr as a dye. Now poured the agarose gel in agarose gel plate inserting the comb. Eject the comb after 15-20 minutes when the gel got set.Weight the container before melting so that the actual amount was adjusted. 0.8% agarose commonly used for DNA quantification.
2.10. Preparation of Lodging Sample
2 µl of chilled standard ladder (Fermentas inc.) with a dye Bromo phenol blue (AgBr) added on the parafilm as a spotting in a desired number (three) and desired place. Loading of content in the gel were done well. Then electrophoretic unit was run for 80 to 90 minutes.
2.11. Autoradiography/Fingerprinting
Autoradiography of electrophoretic run plate were done after 80-90 minutes later by UV ray photography in dark room.
2.12. Band Scoring
Presence and abscence of band were counted. Then identification of presence/absence of DNA in respective lines were done.Score 1 was provided for presence of band and 0 was provided for abscence of band.
2.13. Statistical Analysis
The amplified products were scored as bands on visualization on gel on UV illuminator. Only the reliable bands were included in analysis. These scored bands were computed into binary matrix. The presence of bands was scored as "1" and absence of band was scored as "0". The respective data analysis, data entry and processing was carried out by using Microsoft Excel 2007. UPGMA clustering and PCA was done by using SequentiX ClusterVis (Version 1.8.1). Percentage of molecular variance was found out by GenAlExx6.5b3.xls.
2.14. Cluster Analysis
The binary data matrix was analysed with SequentiX ClusterVis. Cluster analysis, a method for displaying the similarity or differences between pairs of subjects in a set, was employed for grouping together genotypes that showed similarity in the microsatellite patterns. The genetic similarities (GS) were calculated for each pair of accessions using similarity coefficient (SM) and Jaccard’s Coefficient of similarity for genotyping data and morphological attributes respectively. The similarity matrix were used to construct UPGMA (Un-weighted pair group methods using arithmetic averages algorithm) clustering and neighbor-joining grouping methods to visualize the relationships among lentil accessions in dendrogram with the help of Sequential, Agglomerative, Hierarchial and Nested (SAHN) clustering methods (Sneath and Sokal, 1973).
2.15. Polymorphic Information Content (PIC)
The gene diversity was calculated according to the formula of Nei (1973); Gene diversity
![]()
where Pi is the frequency of ith microsatellite allele present in the examined accessions. Anderson et al. (1993) referred to gene diversity as the polymorphic information content (PIC). Polymorphic Information Content (PIC) for each marker was calculated. The number of alleles per locus, size range, gene frequencies and genetic distance were estimated. The PIC value index is the function of gene frequencies.
Table 1. 96 lentil accessions used in this study based on source of origin
| DNA SN | Variety name | Source of origin | DNASN | Variety name | Source of origin |
| 1 | LN-0135 | Nepal Local | 13 | ILL-10071 | ICARDA |
| 25 | LN-0136 | Nepal Local | 14 | ILL-9924 | ICARDA |
| 91 | Arial | Nepal Local | 15 | ILL-6465 | ICARDA |
| 95 | KhajuraMasuro- 2 | Nepal Local | 16 | ILL-9926 | ICARDA |
| 2 | RL-45 | Nepal Cross | 17 | ILL-6458 | ICARDA |
| 3 | RL-67 | Nepal Cross | 18 | ILL-1020 | ICARDA |
| 4 | RL—49 | Nepal Cross | 19 | ILL-6811 | ICARDA |
| 5 | RL-79 | Nepal Cross | 20 | HUL-57 | ICARDA |
| 7 | RL-56 | Nepal Cross | 21 | Sagun | ICARDA |
| 8 | RL-68 | Nepal Cross | 22 | M.Bharati | ICARDA |
| 9 | RL-8 | Nepal Cross | 23 | ILL-7162 | ICARDA |
| 10 | X94S-48 | Nepal Cross | 24 | ILL-7723 | ICARDA |
| 34 | RL-4 | Nepal Cross | 26 | ILL-3768 | ICARDA |
| 44 | RL-60 | Nepal Cross | 28 | ILL-8006 | ICARDA (BM-4) |
| 47 | RL-70 | Nepal Cross | 29 | ILL-7537 | ICARDA |
| 48 | RL-73 | Nepal Cross | 31 | IL-1 | ICARDA |
| 53 | RL-71 | Nepal Cross | 32 | ILL-7979 | ICARDA |
| 54 | NR 2001-72-3 | Nepal Cross | 33 | ILL-7715 | ICARDA |
| 57 | RL-75 | Nepal Cross | 35 | ILL-6467 | ICARDA |
| 58 | RL-35 | Nepal Cross | 36 | ILL-7164 | ICARDA |
| 59 | RL-43 | Nepal Cross | 37 | ILL-3490 | ICARDA |
| 60 | RL-69 | Nepal Cross | 38 | ILL-6419 | ICARDA |
| 61 | RL-44 | Nepal Cross | 40 | ILL-3111 | ICARDA |
| 62 | RL-42 | Nepal Cross | 41 | ILL-2527 | ICARDA |
| 63 | RL-76 | Nepal Cross | 42 | FLIP 2006-99L | ICARDA |
| 64 | RL-26 | Nepal Cross | 43 | FLIP 95-1L | ICARDA |
| 65 | RL-41 | Nepal Cross | 45 | FLIP 2009-60L | ICARDA |
| 66 | RL-39 | Nepal Cross | 46 | FLIP 04-60L (ILL-10013) | ICARDA |
| 67 | RL-58 | Nepal Cross | 6 | ILL-3338 | ICARDA |
| 68 | RL-62 | Nepal Cross | 50 | ILL-6021 | ICARDA |
| 69 | RL-47 | Nepal Cross | 51 | FLIP 05-24L (ILL-10045) | ICARDA |
| 70 | RL-80 | Nepal Cross | 52 | FLIP 05-24L (ILL-10065) | ICARDA |
| 71 | RL-21 | Nepal Cross | 55 | FLIP 2008-7L | ICARDA |
| 72 | RL-23 | Nepal Cross | 56 | FLIP 2009-54L | ICARDA |
| 75 | RL-94 | Nepal Cross | 73 | FLIP 05-52L (ILL-10073) | ICARDA |
| 78 | NR 2001-71-4 | Nepal Cross | 74 | ILL-6260 | ICARDA |
| 79 | RL-74 | Nepal Cross | 76 | X39S-66L | ICARDA |
| 80 | RL-20 | Nepal Cross | 77 | ILL-10134 | ICARDA |
| 81 | RL-25 | Nepal Cross | 83 | ILL-10068 | ICARDA |
| 82 | RL-95 | Nepal Cross | 87 | ILL-7664 | ICARDA |
| 84 | RL-22 | Nepal Cross | 88 | Digger | ICARDA |
| 85 | RL-38 | Nepal Cross | 89 | Bari Musuro-4 | ICARDA |
| 86 | RL-5 | Nepal Cross | 92 | ILL-6458 | ICARDA |
| 90 | NX 9901 – 1 | Nepal Cross | 93 | X 95583 | ICARDA |
| 96 | RL 28 | Nepal Cross | 94 | FLIP 2009 – 59L ( ILL 10716) | ICARDA |
| 97 | RL-78 | Nepal Cross | 27 | DPL-62 | India |
| 11 | ILL-2712 | ICARDA | 30 | WBL-77 | India |
| 12 | ILL-1970 | ICARDA | 39 | LG-12 | India |

 Table 2. List of forward and reverse SSR primers used for lentil characterization, with annealing temperature, expected size and microsatellite motifs
| S.N. | SSR No. | Forward | Reverse | Annealingtemp.(Tm) used forPCR(0C) | Xpected size(bp) |
| 1 | SSR 34-2 | CGGCGGATGAAACTAAAG | CATTTCCTTCACAAACCAAC | 53 | 185 |
| 2 | SSR 66 | GGTAGTGGTGAGGAATGAC | GCATCACTGCAACAGACC | 55 | 253 |
| 3 | SSR 90 | CCGTGTACACCCCTAC | CGTCTTAAAGAGAGTGACAC | 55 | 181 |
| 4 | SSR 132RN | CCAGAACAAACGTAAACC | CTATCGCATATGAGTGAAC | 52 | 330 |
| 5 | SSR 191 | GCAAATTTCTTGGTCTACAC | GGGCACAGATTCATAAGG | 53 | 238 |
| 6 | SSR 197 | CACCAATCACCAACACAC | GAGCTGTGAAGTCTTATCTG | 54 | 173 |
| 7 | SSR 207 | GAGAGATACGTCAGAGTAG | GATTGTGCTTCGGTGGTTC | 55 | 227 |
| 8 | SSR 230 | CCAACAACAATTCACCATAC | AACATTGTACTGAGAGGTG | 53 | 251 |
| 9 | SSR 33 | CAAGCATGACGCCTATGAAG | CTTTCACTCACTCAACTCTC | 56 | 289 |
| 10 | SSR 19 | GACTCATACTTTGTTCTTAGCAG | GAACGGAGCGGTCACATTAG | 58 | 250 |
| 11 | SSR 48 | CATGGTGGAATAGTGATGGC | CTCCATACACCACTCATTCAC | 57 | 165 |
| 12 | SSR 96 | GTTATCTTCCAGCGTC | GATATACAATCAGAGATG | 49 | 210 |
| 13 | SSR 99 | GGGAATTTGTGGAGGGAAG | CCTCAGAATGTCCCTGTC | 57 | 161 |
| 14 | SSR 107 | GCGGCGAGCAAATAAAT | GGAGAATAAGAGTGAAATG | 51 | 161 |
| 15 | SSR 113 | CCGTAAGAATTAGGTGTC | GGAAAATAGGGTGGAAAG | 51 | 211 |
| 16 | SSR 119 | GAACTCAGTTTCTCATTG | GAACATATCCAATTATCATC | 49 | 266 |
| 17 | SSR 124 | GTATGTGACTGTATGCTTC | GCATTGCATTTCACAAACC | 52 | 174 |
| 18 | SSR 130 | CCACGTATGTGACTGTATG | GAAAGAGAGGCTGAAACTTG | 55 | 196 |
| 19 | SSR 156 | GTACATTGAACAGCATCATC | CAAATGGGCATGAAAGGAG | 53 | 176 |
| 20 | SSR 167 | CACATATGAAGATTGGTCAC | CATTTATGTCTCACACACAC | 54 | 160 |
| 21 | SSR 199 | GTGTGCATGGTGTGTG | CCATCCCCCTCTATC | 51 | 182 |
| 22 | SSR 204 | CACGACTATCCCACTTG | CTTACTTTCTTAGTGCTATTAC | 53 | 186 |
| 23 | SSR 212-1 | GACTCATTGTTGTACCC | GCGAGAAGAATGGTTG | 50 | 181 |
| 24 | SSR 213 | CACTCGCACCTCTTATG | GAAATTGTCTCTTAGCAAG | 51 | 151 |
| 25 | SSR 309-2 | GTATGTCGTTAACTGTCGTG | GAGGAAGGAAGTATTCGTC | 50 | 182 |
| 26 | SSR 317-1 | GTGGGTGTAATTATTGCTAC | GTATCAAACTTATGGTGAAATC | 53 | 308 |
| 27 | SSR 317-2 | CACGTAACATCTTGCTTATG | GTAGCAATAATTACACCCAC | 53 | 120 |
| 28 | SSR 323 | AGTGACAACAAAATGTGAGT | GTACCTAGTTTCATCATTG | 51 | 250 |
| 29 | SSR 336 | GTGTAACCCAACTGTTCC | GGCCGAGGTTGTAACAC | 54 | 253 |
| 30 | SSR 183 | GCTCGCATTGGTGAAAC | CATATATAGCAGACCGTG | 52 | 119 |
| 31 | SSR 202 | CAACCTCACTTACCTTAC | GCTCTTTATCATCATTCTAC | 52 | 220 |
| 32 | SSR 28 | GAGGGCATAAATTCAGATTC | GGACAACGCACATTTGATG | 53 | 383 |
| 33 | SSR 72 | CAAACAGTACAAGGAAAGGAG | CTGACTGAGCTGCTTGAAC | 55 | 253 |
3. Results and Discussion
3.1. Multivariate Analysis
3.1.1. Cluster Analysis
The genetic relationships at DNA level among the accessions were further studied using cluster analysis based on UPGMA. The SSR based dendrogram for genetic diversity based on 96 genotypes of lentil was constructed and presented in figure 1. The cluster diagram using Jaccard’smethod proposedtwo major groups for genetic diversity analysis. The critical examination of the dendrogram revealed four clusters. Group A consisted ofthree clusters (I, II and III) and Group B consisted of only one cluster (IV). As this cluster analysis was based onlentil PCR band, cluster were obtained on the basis of similarity percentage, genetic relatedness and centre of origin.
In Group A, fifty six genotypes were found in cluster I which represented 58.33 %of total genotypes. This cluster represented the genotypes showing same center of origin andgenetic closeness. Cluster I was the largest cluster in Group A and among all cluster. Due to its large size, Cluster I was again divided into two sub cluster viz. Sub cluster Ia and Sub cluster Ib. Sub cluster Ia consisted fourty two genotypes (LN-0135, Khajura Musuro-2, X94S-48, RL-4, RL-69, RL-41, NR-2001-71-4, RL-22, RL-38, ILL-7164, ILL-6419, ILL-6260, X39S-66L, RL-49, RL-56, RL-8, RL-70, RL-75, RL 47, NX9901-1, ILL-3490, ILL-10134, RL-35, RL-42, LG-12, RL-45, RL-71, RL-26, ILL-8006, RL-44, RL-76, RL-95, RL-5, ILL-7537, RL-67, FLIP-2009-59L (ILL-10716), ILL-6467, FLIP-2009-60L, RL-43, ILL-3338, RL-23, LN-0136) which represented 75 % of total genotypes of Cluster I. Sub cluster Ib consisted fourteen genotypes (Arial, RL-20, RL-25, RL-68, RL-94, RL-28, RL-78, RL-60, RL-39, RL-74, RL-58, RL-21, RL-62, RL-80) which represented 25 % of total genotypes of Cluster I. In Cluster I, Sub cluster Ib was the smallest cluster and Sub cluster Ia was the largest based on number of genotypes. Cluster I represented mostly RL series in which sub cluster Ib had only RL lines except Arial. In the same Group A, thirty seven genotypes were found in cluster II which represented 38.54 % of total genotypes. Cluster II was again divided into sub cluster IIa, sub cluster IIb and sub cluster IIc. Sub cluster IIa had sub cluster IIa1 and sub cluster IIa2. Sub cluster IIa1 consisted ten genotypes (RL-79, ILL-2712, HUL-57, IL-1, ILL-7979, ILL-7715, ILL-2527, FLIP-2009-54L, X-95583, ILL-6021) which represented 27.02 % of total genotypes of cluster II and 38.46 % of total genotypes of sub cluster IIa. Sub cluster IIa2 consisted sixteen genotypes (ILL-1970, ILL-9926, ILL-6811, ILL-3768, FLIP-2008-7L, FLIP-2005-52L (ILL-10073), ILL-6458, DPL-62, ILL-1020, Maheshwor Bharati, FLIP-04-60L (ILL-10013), FLIP-05-24L (ILL-10045), ILL-9924, ILL-6465, ILL-10071, WBL-77) which represented 61.53 % of sub cluster IIa and 43.24% of total genotypes of cluster II. In the same way, sub cluster IIb contained six genotypes (RL-73, ILL-7162, ILL-7723, NR-2001-72-3, ILL-3111, FLIP-05-24L (ILL-10065) which represented 16.21 % of cluster II. Sub cluster IIc contained five genotypes (FLIP-2006-99L, FLIP-95-1L, ILL-7664, Digger, Bari Musuro) which represented 13.51 % of cluster II. Similarly, two genotypes (ILL-6458, ILL-10068) were found in cluster III which represented 2.08 % of total genotypes. In Group B, only one genotypes (Sagun) was found in cluster IV which represented 1.04 % of total genotypes. Cluster II represented mostly ILL series. Cluster IV was the smallest cluster among all cluster with only one genotypes. All Nepalese local landraces were found in cluster I only.
Pop1 (Nepal Local) accessions were found in cluster I (DNA SN 1, 25, 91, 95). Pop2 (Nepal Cross) accessions were found in cluster I (DNA SN 2, 3,4, 7, 8, 6, 9, 10, 34, 47,44, 66, 53, 57, 58, 59, 60, 61, 62, 63, 64, 65,67,68, 69, 70, 71, 72,75 78, 79, 82, 84, 85, 86, 90, 96, 97, 80, 81) and cluster II (DNA SN 5,11,48, 54). Pop3 (ICARDA Line) accessions were found in cluster I (DNA SN 6, 28, 29, 35, 36, 37, 38, 45, 74, 76, 77, 94), cluster II (DNA SN 11, 12, 13,14, 15, 16, 18, 19, 20, 22, 23, 24, 26, 31, 32, 33, 40, 41, 42, 43, 46, 50, 51, 52, 55, 56, 73, 87, 88, 89, 92, 93), cluster III (DNA SN 17, 83) and cluster VI (DNA SN 21). Similarly, Pop4 (Indian Line) accessions were found in cluster I (DNA SN 39) and cluster II (DNA SN 27, 30) (Table 1 and Figure 1).
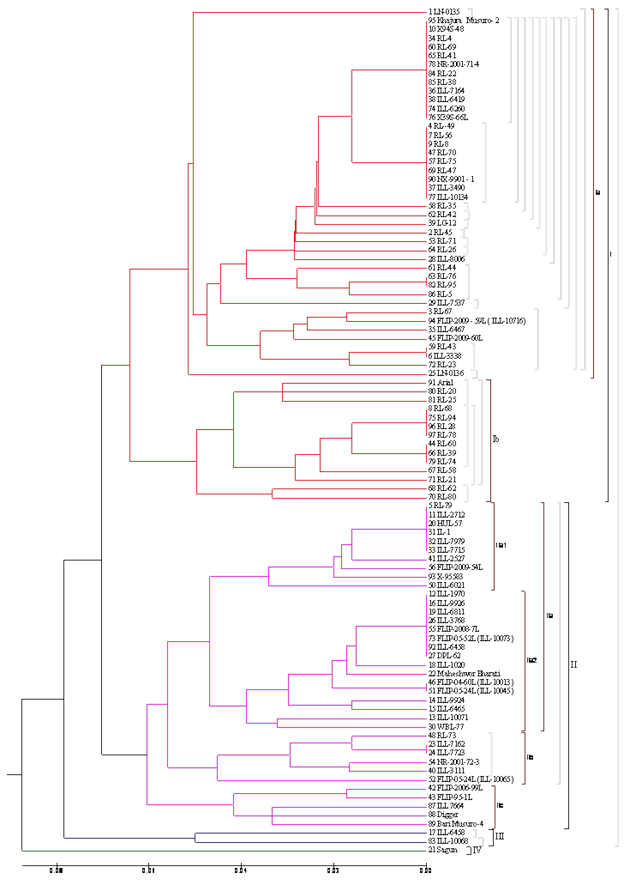
Figure 1. Dendrogram depicting genetic relationship among 96 lentil accessions based on similarity coefficient using 33 polymorphic SSR marker by Jaccard’s method
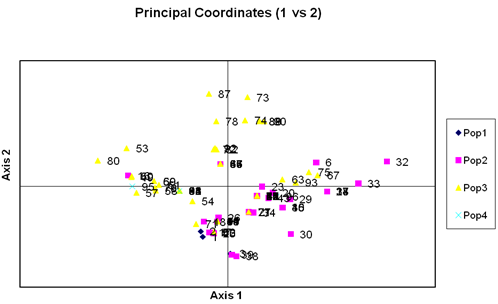
Figure 2. Principal coordinates analysis of first two components for 96 lentil accessions by GenAlEx.
Microsatellite profiling based dendrogram also revealed that RL lines were more diverged than ILL lines and distributed across the four clusters (Figure 1). Among all lentil accessions Sagun and LN 0135 showed the distant relationship as compared to others in dendrogram. The present results based on SSR profiling are much similar to the earlier reports (Fikiru et al., 2010; Hamweih etal., 2009). Fikiru et al. (2010) observed five groups of lentil by analysing 70 Ethiopean lentil accessions using set of ISSR markers. Likewise, Babayeva et al. (2009) classified 39 lentil accessions from Central Asia and Caucasian region and found six cluster using five pair of SSR markers. Other research also reported five to nine cluster using SSR marker in diverse lentil accessions. On contrary to this, Alabboud et al. (2009) reported very low level of genetic diversity with only two groups signifies low level of dectective power of RAPD comparing to SSR marker system. Hamwieh et al. (2009) observed the highest genetic diversity in wild and cultivated species using SSR-66 in contrary to the present result reflecting the lentil accessions included in this study are relatively diverse and in most of the accessions displayed heterozygosity for that locus. The heterozygosity in this locus probably due to the introgression of genes or duplication of microsatellite motif during the breeding and or the course of lentil line evolution. Thus the level of genetic diversity detection largely depends on the type of molecular markers, nature of SSR repeat motif, number of SSR markers and the genetic relatedness of the lentil germplasm to be analysed.
3.1.2. Principal Coordinate Analysis
The variation among the genotypes was also studied by Principal Coordiante Analysis (PCoA) for genetic diversity of ninety six lentil genotypes. The principal coordinate analysis yielded Eigen values of each principal coordinate axis of ordination of genotypes with the first accounting for the variation among the genotypes (Charaborty and Haque, 2000). Principal coordinate analysis was carried out with 96 genotypes of lentil. The first three Eigen values for three principal coordination axes of genotypes accounted for 71.08 % variation (Table 3).
Table 3. Percentage of variation explained by the first 3 axes with PCoA for 96 lentil accessions
| Axis | 1 | 2 | 3 |
| % | 31.82 | 21.94 | 17.32 |
| Cumulative % | 31.82 | 53.76 | 71.08 |
| Eigen value | 2.314 | 1.595 | 1.259 |
Table 4. Name of 33 primers and their potential to detect the genetic polymorphism in 96 lentil accessions with polymorphic information content value (PIC)
| S.N. | Name of primer | PIC | SN | Name of primer | PIC |
| 1 | SSR 34-2 | 0.305312 | 18 | SSR 130 | 0 |
| 2 | SSR 66 | 0 | 19 | SSR 156 | 0.061952 |
| 3 | SSR 90 | 0.5 | 20 | SSR 167 | 0.041118 |
| 4 | SSR 132 RN | 0.021758 | 21 | SSR 199 | 0.021758 |
| 5 | SSR 191 | 0.135342 | 22 | SSR 204 | 0.276888 |
| 6 | SSR 197 | 0.061952 | 23 | SSR 212-1 | 0.061952 |
| 7 | SSR 207 | 0.47795 | 24 | SSR 213 | 0.170328 |
| 8 | SSR 230 | 0.041118 | 25 | SSR 309-2 | 0.080472 |
| 9 | SSR 33 | 0.080472 | 26 | SSR 317-1 | 0.061952 |
| 10 | SSR 19 | 0.021758 | 27 | SSR 317-2 | 0.041118 |
| 11 | SSR 48 | 0.021758 | 28 | SSR 323 | 0.061952 |
| 12 | SSR 96 | 0.041118 | 29 | SSR 336 | 0.021758 |
| 13 | SSR 99 | 0.021758 | 30 | SSR 183 | 0.061952 |
| 14 | SSR 107 | 0.118062 | 31 | SSR 202 | 0 |
| 15 | SSR 113 | 0.021758 | 32 | SSR 28 | 0.061952 |
| 16 | SSR 119 | 0.021758 | 33 | SSR 72 | 0 |
| 17 | SSR 124 | 0.041118 | Total | 2.958144 | |
| Mean | 0.08964 |
The first two principal axes accounted for 53.76 % of total variation describing 96 genotypes. The results obtained from principal coordinate analysis showed the highest inter genotypic distance between genotypes. The clustering pattern obtained coincided with the apparent grouping patterns performed by PCA. So the results obtained through PCA were confirmed by non-hierarchical clustering.
3.2. Polymorphic Information Content
Selected 33 polymorphic SSR primers generated 152 alleles among the lentil lines. Polymorphism features of each SSR markers are shown in Table 4. The alleles number for SSR loci ranged from 0 (SSR 130) to 15 (SSR 191) with a mean of 4.6 alleles. The polymorphic information content (PIC) value ranged from 0 (SSR 66, SSR 202 and SSR 72) to 0.5 (SSR 90) with the mean PIC was 0.089. SSR markers such as SSR 90, SSR 34-2, SSR 204 were more informative with PIC values 0.5, 0.30 and 0.27 respectively. Similar results have been reported by several authors using SSR, RAPD and ISSR profiling in the literature (Hamweih et al., 2009 and Alabboud et al., 2009). Hamweih et al. (2009) observed that cultigens accessions are less diverse comparing to wild accessions. Their study revealed that the diversity index for same set of SSR markers ranged from 0.03 to 0.87 with a mean of 0.65 in 109 accessions from 15 countries representing 57 cultigens and breeding lines from eight countries. Unlike their observation on PIC value, the present study revealed that relatively littlepolymorphism in 96 lentil breeding lines being used in this study.
4. Summary and Conclusion
Lentil is a major pulse crop of Nepal and is a major source of protein for poor Nepalese people. It is the only one pulse commodity through which foreigh currency is earned. Lentil is highest in terms of acreage (207,591 ha) and production (206,869 metric ton) (MOAD, 2011). It is unique because it can be grown in marginal land and rainfed climate. It resists drought and cold; thus it is a famous pulse crop from terai to hills of Nepal. Before initiation of lentil breeding activities there is urgent need to characterize, evaluate lentil germplasm available to us. In fact lentil germplasm has not been characterized on molecular level yet in Nepal.Variation between and within populations of crop species is useful for analyzing and monitoring germplasm during the maintenance phase and predicting potential genetic gain in a breeding programme. It is important to know the genetic diversity of lentil among local accessions and exotic germplasm for important traits to use in breeding programs. The available genotypes will serve as the most valuable material reservoir for providing the desirable plant attribute for obtaining the high yielding crop varieties.
Thus for genetic characterization, ninety six germplasm of lentil were collected from NGLRP, Rampur; RARS, Nepalgunj and NAGRC (Gene Bank), Khumaltar. These lines were divided into four populations based on center of origin. Among them; four lines were Nepalese native/local line (Nepal Local), forty two lines were crossed in NGLRP, Rampur (Nepal Cross);forty seven lines were from ICARDA (ICARDA Line); and finally three lines from India (Indian Line).All accessions were characterized by DNA fingerprinting using thirty three selected polymorphic SSR primers. The material and methods included genetic characterization by DNA fingerprinting using SSR marker followed by modified CTAB method for lentil DNA isolation, DNA quantification, PCR amplification, agarose gel preparation, preparation of lodging sample, autoradiography and band scoring respectively. Data entry and processing was carried out by using Microsoft Excel 2007. UPGMA clustering and genetic distance was obtained by using SequentiX ClusterVis (Version 1.8.1) and GenAlEx6.5b3.xls respectively. PCoA and percentage of molecular variance was found out by GenAlEx˟6.5b3.xls. The characterization was done in Biotechnology Unit, NARC Khumaltar, Lalitpur.
The critical examination of the dendrogram usingJaccard’smethod revealed four clusters under two group for genetic diversity of 96 lentil accessions. Group A consisted ofthree cluster (I, II and III) and Group B consisted of only one cluster (IV). As this cluster analysis was based on lentil PCR band, cluster were obtained on the basis of similarity percentage, genetic relatedness and centre of origin. Cluster I represented 58.33 % of total genotypes followed by cluster II (38.54 %); cluster III (2.08 %) and cluster IV (1.04 %). Cluster I was largest cluster among all. Thus it was again divided into sub cluster Ia and sub cluster Ib representing 75 % and 25 % of total genotypes of cluster I respectively. Cluster II had sub cluster IIa, sub cluster IIb and sub cluster IIc representing 70.31 %, 16.21 %, and 13.51 % of total genotypes of cluster II respectively. Sub cluster IIa again divided as sub cluster IIa1 and sub cluster IIa2 representing 27.07 %and 43.24 % of total genotypes of cluster IIa respectively (Figure 1). The first three Eigen values for three principal coordination axes of genotypes accounted for 71.08 % variation (Table 3). The first two principal axes accounted for 53.76 % of total variation describing 96 genotypes. The clustering pattern obtained coincided with the apparent grouping patterns performed by PCA. So the results obtained through PCA were confirmed by non-hierarchical clustering. Similarly, molecular variance analysis showed that 14 % genetic variation was found between population and 86 % genetic variation was found within population with estimated variance0.228 between population and 1.353 within population. Highest genetic distance (9) was found between landrace 32 (ILL-7979) and 80 (RL-20). In the same way, the pair wise population matrix showed that pop1 and pop4 had highest (0.033) Nei genetic distance and lowest genetic distance were found within the same population accessions. Similarly, pop3 and pop2 had highest (0.017) Nei Unbiased Genetic distance and lowest distance was found within the same population.SSR markers such as SSR 90, SSR 34-2, SSR 204 were more informative with PIC values 0.5, 0.30 and 0.27 respectively. The present study revealed that relatively littlepolymorphism in 96 lentil breeding lines being used in this study.
Microsatellite profiling based dendrogram revealed that RL lines were more diverged than ILL lines and distributed across the four clusters (Figure 1). Among all lentil accessions LN 0135 and Sagun showed the distant relationship as compared to others in dendrogram. The heterozygosity were probably due to the introgression of genes or duplication of microsatellite motif during the breeding and or the course of lentil line evolution. Thus the level of genetic diversity detection largely depends on the type of molecular markers, nature of SSR repeat motif, number of SSR markers and the genetic relatedness of the lentil germplasm to be analysed. All ninety six genotypes involved in the study of genetic characterization exhibited wide range ofgenetic variability due to different center of origin, different genetic constitution and different cluster forming group. The diversity detected in this study may constitute the foundation for future systematic lentil breeding programs. Thus these untaped genes source could play a vital role to enhance the yield potential of the lentil globally. The research also help to select promising genotypes for selection and crossing and to get result from target oriented research work.
References
- Ahmad, M., D.L. McNeil and A.G. Fautrier. 1997. Phylogenetic relationships inLensspecies and parentage determination of their interspecifichybrids using RAPD markers. Euphytica 94: 101-110.
- Alabboud, I., L. Szilagyi and G.H.V. Roman. 2009. Assessment of genetic diversity in lentil (Lens culinaris Medik) as revealed by RAPD markers. Scientific papers, USAMV Bucharest, Series A, Vol. LII. 439p.
- Anonymous. 2003. Lentil: situation and outlook. Bi-weekly Bulletin,13(21)Available at:http://www.agr.ca/policy/winn/biweekly/index.htm(Retrieved on 23rd December 2012).
- Bahl, P.N., S. Lal and B. M. Sharma. 1993.An overview of the production and problems inSoutheast Asia. In W. Erskine and M. C. Saxena (eds.)Lentil in South Asia. Proceedings of theseminar on lentils in south Asia ICARDA, Aleppo, Syria. pp.1-10.
- Bhatty, R.S. 1998. Composition and quality of lentil (Lens culinarisMedik): A review. Canadian Institute of FoodScience and Technology 21: 144–160.
- Chakraborty, M. and M.F. Haque. 2000. Genetic variability and component analysis in lentil (Lens culinaris Medik). J Res.Birsa Agric. Uni. 12(2): 199-204.
- Cubero, J.I. 1981. Origin, taxonomy and domestication. In: Webb C,Hawtin G (Eds.), Lentils, pp: 15-38. C.A.B., Landon, UK.
- Doyle, J.J. and J.L. Doyle. 1987. A rapid DNA isolation procedure for small quantities of fresh leaf tissue. Phytochemical Bulletin 19: 11-15.
- Erskine, W., B. Bayaa and M.C. Saxena. 1996. Registration of ILL 5588 lentil germplasmresistant to vascular wilt and ascochyta blight. Crop Sci. 36, 1080.
- Eujayl, I., Baum M., W. Erskine, E. Pehu and F.J. Muehlbauer. 1997. The use of RAPD markers for lentil geneticmapping and the evaluation of distorted F2 segregation.Euphytica 96: 405-412.
- FAOSTAT. 2005. Available at:http://faostat.fao.org/(Retrieved on 23rd December 2012).
- Fikiru, E., K. Tesfaye and E. Bekele. 2010. A comperative study of morphological and molecular diversity in Ethiopean lentil (Lens culinaris Medikus) landraces. African journal of Plant Science 4: 242-254.
- Hamwieh, A., S.M. Udupa, A. Sarkar, C. Jung and M. Baum. 2009. Develpoment of new microsatellite markers and their application in the analysis of genetic diversity in lentils. Breeding Science 59: 77-86.
- Hamwieh, A., S.M. Udupa, W. Choumane, A. Sarker,F. Dreyer, C. Jung and M. Baum. 2005. A genetic linkagemap of Lens sp. based on microsatellite and AFLPmarkers and the localization of fusarium vascular wiltresistance. Theor. Appl. Genet. 110: 669-677.
- Hayward, M.D. and E.L. Breese. 1993. Population structure and variability. In:Plant Breeding: Principles and Prospects, (Eds.): M.D. Hayward, N.O. Bosemark and I. Romayosa, Chapman and Hall, London. pp. 17-29.
- Jha, S.S. and D. Ohri. 1996. Phylogenetic relationships of Cajanus cajan(L.)Millsp. (Pigeonpea) and its wild relatives based on seed proteinprofiles. Genet. Resour. Crop Evol. 43: 275-281.
- Linacero, R.J., Rueda and A.M. vazquez. 1998. Quantifying of DNA. Karp, A., P.G. Isaac, and D.S. Ingram (eds.) molecular tools for screening biodiversity: plants and animals. Chapman and hall. London, Weinheim, new york, Tokyo, Melbourne, madras. pp. 18-21.
- Margale, E., Y. Herve, J. Hu and C.V. Quiros. 1995. Determination of geneticvariability by RAPD markers in cauliflower, cabbage and kale localcultivar from France. Genet. Resour. Crop Evol. 42: 281-289.
- MoAD.2011. Stastistical Information on Nepalese Agriculture 2010-11. Government of Nepal, Ministry of agriculture and Development, Agribusiness promotion and Stastistics Division, Singh Darbar, kathmandu, Nepal. Availabel at: http://www.moad.gov.np/agriculture(Retrieved on 10th January 2013).
- Nazir, S., E. Bashir, R. Bantel and Habib-ul-Rehman Mian. 1994. Crop Production. NationalBook foundation, Islamabad. pp. 294-300.
- Nienhuis J., Tivang J. and Skroch P. 1995. Genetic relationship amongcultivars and landraces of lima bean (Phaseolus lunatusL.) asmeasured by RAPD markers. J. Amer. Soc. Hort. Sci. 120: 300-306.
- Sambrook, J., E.F. Fritch and T. Manniatis. 1989. Molecular cloning: A laboratory manual, (2nd edition), Cold Spring harbor Laboratory Press, Cold spring Harbor, NY.
- Savage, G.P. 1988. The composition and nutritive value oflentils. Nature Abstract Review 58: 319–343.
- Sneath, P.H.A. and R.R. Sokal. 1973. Numerical taxonomy. Freeman, San Francisco.
- Sonnante, G. andD. Pignone. 2001. Assessment of genetic variation in a collection of lentilusing molecular tools. Euphytica 120: 301–307.
- Virk, P.S., B.V. Ford-Lloyd, M.T. Jackson and H. John. 1995. Use of RAPD forthe study of diversity within plant germplasm collections. Heredity 74:170-179.


