
Journal of Agricultural Science and Engineering, Vol. 3, No. 1, February 2017 Publish Date: Jan. 21, 2017 Pages: 13-19
An Assessment of the Mvutjini Earth Dam Water Quality at Kalanga, Swaziland
Zodwa Phindile Ndlela, Bruce Roy Thulane Vilane*, Nothando Fortunate Nkambule
Department of Agricultural and Biosystems Engineering, Faculty of Agriculture, University of Swaziland, Luyengo Campus, Swaziland
Abstract
Dams can provide the water needed for various applications in arid and semi-arid environments. However, most of these surface water sources are polluted with pollution from various sources including agricultural pollution. A study was carried out to assess the quality of the Mvutjini earth dam reservoir water. The research was an experiment with one treatment; the Mvutjini earth dam reservoir water. Water samples were collected from three different sites of the dam, used as water collection points by the community. The samples were collected after it had rained enough to cause runoff (Wet Season) and when it had not rained (Dry Season). The dam water was tested for Physical (pH and Turbidity), Biological (Total coliforms and faecal coliforms) and Chemical quality (Nitrates and hardness). The results reflected that the physical quality with respect to the mean pH for the Mvutjini dam water was 7.45, 7.31 and 6.80 for the Wet Season, Dry Season and the treated SWSC tap water (control), respectively. The pH was significantly different between the seasons. The mean Turbidity was 0.96 NTU and 0.74 NTU during the Wet and Dry Seasons, respectively, while the SWSC treated tap water, which was used as the control had a turbidity of 0.55 NTU. The mean turbidity was significantly different between the seasons. The bacteriological quality (Total coliforms and faecal coliforms) results indicated that the mean Total coliforms were 3654 counts per 100 ml (Wet Season), 2420 counts per 100 ml (Dry Season). The mean faecal coliforms i.e. E. coli were higher (3433 counts/100 ml) in the Wet Season than during the Dry Season (2100 counts/ 100 ml). The chemical quality (nitrates and hardness) results indicated that the mean nitrates were 7.2 mg/L and 9.8 mg/L during the Dry Season and Wet Season, respectively. The amount of nitrates present in all the water samples was below the WHO water quality guideline (< 10 mg/L). The mean hardness was 59.7 mg/L, 56.5 mg/L and 53.7 mg/L for the Wet Season, Dry Season and the SWSC treated tap water, respectively. It was concluded that the Mvutjini dam reservoir water was polluted with E. coli, while the chemical quality (nitrates and hardness) were acceptable.
Keywords
Mvutjini, Earth Dam, Water Quality, Kalanga, Swaziland
Received: November 28, 2016
Accepted: December 20, 2016
Published online: January 21, 2017
@ 2016 The Authors. Published by American Institute of Science. This Open Access article is under the CC BY license. http://creativecommons.org/licenses/by/4.0/
Contents
1. Introduction
Dams are barriers constructed to hold back water and raise its levels. Reservoirs created by dams provide water for activities such as irrigation, human consumption, industrial use, aquaculture, and navigability. A dam can also be used to collect water or for storage of water which can be evenly distributed between locations. Current drought in Swaziland has resulted in severe water shortages in both rural and urban areas. On the onset of the drought, 28% of rural water supply schemes were functional and 4% were partially functional especially in the Lubombo and Shiselweni regions. Many of the affected communities switched to alternative water sources such as streams, rivers and earth dams (Government of Swaziland, 2016).
Dams can be classified according to their various functions and construction methods. There are storage dams, which according to Prassida (2015) provide water supply or improved habitat for aquaculture. There are also gravity dams which are designed to hold back large volumes of water. According to the British Dams (Undated) they are constructed with masonry and concrete so that it is able to resist the horizontal thrust pushing water against it. The dams whose embankment is constructed using compacted earth like the Mvutjini dam are called earth dams. Dams can provide the water needed for various applications in both urban and rural environments. However, most of these surface water sources are polluted with pollution from various sources including agricultural pollution. Agricultural pollution refers to biotic and abiotic by products of farming practices that result in contamination of the environment and surrounding ecosystem (Panigrahi et al., 2014). Most of the chemicals applied in agricultural land are rich in nitrogen and phosphorus, these chemicals and fertilizers can provide valuable nutrients to plants. However, if not managed correctly excess N and P can have negative consequences on surface water as they increase nitrates (Mylavarapu, 2014).
In Swaziland a high (47%) proportion of the population residing in the rural areas and peri-urban areas has no access to clean water (Government of Swaziland, 2003). It is estimated that 59% of the rural population, use pit latrines and only 33% of the population has access to clean water (WHO, 2008). People living in rural areas, hence collect water for domestic use from wells, dams, streams and rivers. However, pollution of water sources in rural areas remains a challenge in many developing countries (Grady et al., 2014).
Although, water is essential for the sustenance of all forms of life on earth, it is not evenly distributed all over the world and even its availability at the same locations is not uniform over the year (Mishara, 2010). This scarcity of water has led to the increase in earth dams’ construction in rural areas to meet the water demands by communities. Dam water provides a range of economic, environmental, and social benefits, including recreation, flood control, water supply, hydroelectric power, waste management, river navigation, and wildlife habitat (FEMA, 2015). Besides these humans needs, dams and reservoirs also contribute significantly in fulfilling the ever increasing needs of water for drinking and industrial use (Tortajada, 2014). The quality of surface waters is a very sensitive issue (Saleem et al, 2015). This is more so when it comes to dams such as the Mvutjini earth dam at KaLanga, where the water is not flowing. The water in dam reservoir may degrade in quality over time. According to McCully (undated), the extent of deterioration in water quality is in general related to the retention time of the reservoir, its storage capacity in relation to the amount of water flowing into it. AfroGIS (2008) data base on incidences of water related diseases in KaLanga indicated that 39% of the 217 surveyed households had members who had been treated for water related illnesses in 2007, hence this study.
Objectives
i. To determine the chemical quality of the Mvutjini earth dam reservoir water at KaLanga.
ii. To determine the bacteriological quality of the Mvutjini earth dam reservoir water at KaLanga.
2. Methodology
2.1. Description of the Study Area
The Mvutjini earth dam is located at KaLanga, within the Makhondvolwane community in the central Lowveld of Swaziland. The area receives an annual rainfall of 300 mm to 1000 mm. The dam was constructed by the Ministry of Agriculture with the intention to supply water to a100 ha farm, for livestock and irrigation. Due to unavailability of other water sources, the dam is presently used for domestic water purposes. However, the water resource in the dam is limited and relies on annual precipitation. The water quantity is estimated at 515 000 m3 at 270 m above sea level with an average depth of 6 m (AfroGIS, 2008). This is the only source of water available in the area for the community.
As mentioned above the dam is the only source of water available in the area, hence it is also used by livestock which pollutes the water with their excreta. Surface runoff is one of the sources of pollution as it drives faecal matter into the dam water after rainfall events. The dam catchment area upstream has kraals and some cultivated fields, where kraal manure is used as a source of nutrients to fertilize the soil. During rainfall events excreta are washed down into the earth dam increasing the faecal contamination in the dam water. The other possible cause of faecal contamination is poor sanitation in the area. The use of proper toilets in the area is seemingly not a priority. The people are not keen to build pit latrines even when supplied with building material, as a result only a few homesteads have proper pit latrines. A large fraction of people tend to relieve themselves in nearby bushes within the catchment of the dam. Moreover, disposal of waste such as sanitary napkin and towels is improper as these are dumped in open land. All these waste materials could be potential sources of faecal pollution in the Mvutjini dam water.
2.2. Research Design
The research was an experiment, with one treatment; the Mvutjini earth dam water. Treated tap water from Swaziland Water Services Cooperation (SWSC) was used as a control. Water samples were collected twice during the wet and dry periods. The water samples were collected from 3 sites at the edges of the dam where people collect water for domestic use in line with Cladwell (2006) and in accordance with the conclusion of the Department of Water Affairs and Forestry (2000), which stated that water samples from a dam should be collected at the point of abstraction.
2.3. Sampling Procedure
2.4. Data Collection and Analysis
To avoid decomposition, the water samples were transported to the SWSC laboratory in a cooler box with ice cubes. The samples were tested for the physical, chemical, and bacteriological quality. The data were analysed using Microsoft excel computer software, utilizing standard error bars, which were compared against SWSC treated tap water and WHO drinking water quality guidelines.
2.4.1. Physical Quality Analysis Methods
The physical quality analysis involved performing tests for; pH, and turbidity as outlined next.
i. pH
The table pH meter was used to measure the pH level of water. The electrode was immersed in the sample. Readings were taken after 20-30 seconds after the water readings have stabilized. After each test, the electrode was rinsed with distilled water and wiped dry.
ii. Turbidity
Turbidity was determined using the Absorptometric Method, adopted from FWPCA methods for chemical analysis of water and wastes, 275 (1969). The spectrophotometer wavelength was rotated until the small display showed 450 nm and 25 ml of the sample when placed into the cell holder (Hatch company, 1999). The turbidity guideline value for domestic water is 5 NTU (WHO, 2008).
2.4.2. Bacteriological Quality Analysis Methods
The bacteriological quality test involved performing tests for Total coliforms and Faecal coliforms (E. coli) in the dam water reservoir samples as reflected below.
i. Total Coliforms
The coliform group is made up of bacteria with defined biochemical and growth characteristics that are used to identify bacteria that are more or less related to faecal contaminants. The total coliforms represent the whole group, and are bacteria that multiply at 37°C. Total coliform was determined using reagents, dionized distilled water with the growth medium of 51 g of M-endo ager LES, 25 ml ethanol Abs. and 100 ml of water. The media was boiled. During boiling the media was stirred to avoid the burning of the undissolved media until it was completely dissolved. The media was then allowed to cool to 45-50°C and dispensed ± 15 ml into each of the 65 mm plastic disposable petri dish. The media was then given 10 minutes to solidify. The freshly prepared plates were stored in an inverted position at 4°C in a dark area. Upon testing using the membrane filtration procedure discussed above, where 100 ml of the sample was used, all colonies that had a pink to dark-red colour with a metallic surface were counted and the results expressed as total coliforms per 100 ml.
ii. Faecal Coliforms
The membrane filtration method was used to determine the faecal coliforms (E. coli) in the dam water samples whereby the water was incubated at 45.5 degrees Celsius for 48 hours. The t-test of independent means was used to determine the mean concentration of E. coli in the water samples collected. The E. coli guideline value is 0 counts/100 ml for domestic water (WHO, 2008).
2.4.3. Chemical Quality Analysis Methods
The chemical quality test involved performing tests for the amount of nitrates and hardness in the dam water samples as detailed next.
i. Nitrates
The standard diazotization method using powder pillows was conducted to analyse the amount of nitrate in the water sample. The nitrates guideline value for the amount of nitrates in domestic water is 10 mg/L (WHO, 2008).
ii. Hardness
Hardness in water is caused by calcium and magnesium compounds, and occurs naturally. Excessive hard water cause excessive soap consumption, whilst soft water tends to be corrosive. Higher levels may cause incrustation of utensils and pipe works. Concentrations greater than 500 mg/L are considered undesirable for domestic use. The Titriemetric method was used to determine the amount of hardness.
3. Results and Discussion
3.1. Physical Analysis Results
i. pH
The results in Figure 1 indicated that the mean pH for the Mvutjini dam water was 7.45, 7.31 and 6.80 for the Wet Season, Dry Season and the treated SWSC tap water (control), respectively.
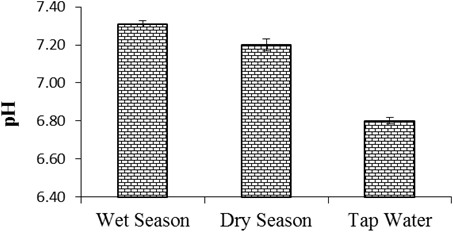
Figure 1. Mvutjini earth dam water Ph.
The results reflected a higher (7.45) pH during the Wet Season than the Dry Season (7.31). The pH was significantly different between the seasons; the same was true between the seasons and the SWSC treated tap water. This could be attributed to runoff driven faecal matter to the dam during the Wet Season.
ii. Turbidity
The results in Figure 2 indicated that the Mvutjini dam water had a mean Turbidity of 0.96 NTU during the Wet Season and 0.74 NTU during the Dry Season, while the SWSC treated tap water, which was used as the control had a turbidity of 0.55 NTU. This trend was similar to the pH, which was high during the wet Season and lower during the Dry Season.
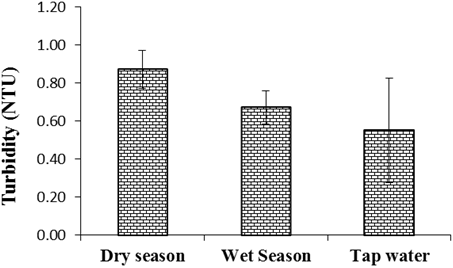
Figure 2. Mvutjini earth dam water turbidity.
The results reflected that the mean turbidity of the Mvutjini earth dam water was significantly different between the seasons. It was higher (0.96 NTU) during the Wet season (0.55 NTU) than in the Dry season. This scenario could be attributed to the runoff prevalent during the wet seasons after rainfall events. The turbidity of the Mvutjini dam water was less than the guideline value for domestic water, which is 5 NTU (WHO, 2008).
3.2. Bacteriological Analysis Results
i. Total Coliforms
The results indicated that there were total coliforms present in the Mvutjini dam water. During the wet season the mean total coliforms were 3654 counts per 100 ml, while during the Dry Season the mean total coliforms were 2420 counts per 100 ml. As expected the SWSC treated tap water, which was used as a control had no total coliforms (Figure 3).
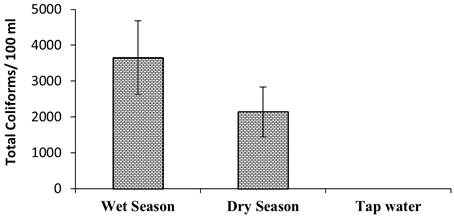
Figure 3. Total coliforms in the Mvutjini earth dam water.
The mean Total coliforms in the Mvutjini dam water were not significantly different between the seasons. However, the mean seasonal Total Coliforms were significantly different to the treated SWSC tap water, which was 0 counts per 1000 ml Total coliforms, as expected.
ii. Faecal Coliforms
The results indicated that the Mvutjini dam water was contaminated with faecal coliforms (Escherichia coli) as shown in Figure 4.
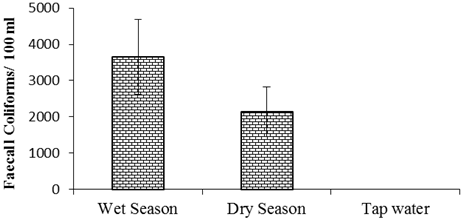
Figure 4. Mvutjini earth dam water faecal coliforms (E. coli).
All the samples collected during the dry period and wet period after rainfall indicated the presence of E. coli. The Escherichia coli detected during the wet period ranged from 1190 counts/100 ml to 5298 counts/100 ml. The samples collected during the dry period had E. coli concentration ranging from 1045 counts/100 ml to 2100 counts/100 ml.
The E. coli levels were much higher (5298 counts/100 ml) in sampling station 2 than in sampling station 1 (3811 counts/100 ml) and 3 (1190 counts/ 100 ml). This could be attributed to the fact that sampling station 2 was the main catchment point of the dam, hence receiving more effluent from the catchment than the other stations. It could therefore be concluded that sampling station 2 was where most of the water with pollutants got into the dam. Sampling station 3 was protected by natural vegetation (grass and shrubs) which filtered the water to a certain degree during runoff, thus lowering the amount of faecal contamination (E. coli) in the dam water at this station.
It was noted that the mean concentration of E. coli was higher (3433 counts/100 ml) after rainfall than during the dry period (2100 counts/ 100 ml). Though higher during the Wet Season, than the Dry Season, the seasonal faecal coliforms were not significantly different from each other. The concentration were above the WHO water quality guideline which state that the value of E. coli in drinking water should be 0 counts/100 ml meaning there should be no indicator of E. coli in water.
3.3. Chemical Analysis Results
i. Nitrates
The results in Figure 5 indicated that there were nitrates present in the water samples. The mean nitrates during the dry period were 7.2 mg/L and it was 9.8 mg/L in the Wet Season. The amount of nitrates present in all the water samples was below the SWSC water quality guideline which state that the amount of nitrates in water should be below 10 mg/L.
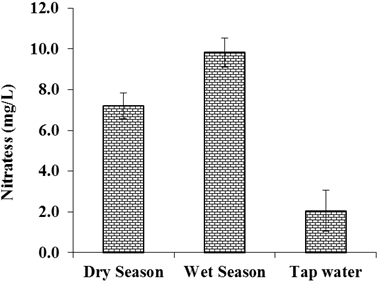
Figure 5. Nitrates in the Mvutjini earth dam reservoir.
ii. Hardness
Hardness is the amount of calcium carbonate equivalent per litre (WHO, 2010). It measures the capacity at which water will react with soap. Hard water will require more soap to reduce lather. Moreover, water containing calcium carbonate at concentration of < 60 mg/L is soft. The results reflected that the mean hardness of the Mvutjini dam water was 59.7 mg/L, 56.5 mg/L and 53.7 mg/L for the Wet Season, Dry Season and the SWSC treated tap water, respectively (Figure 6).
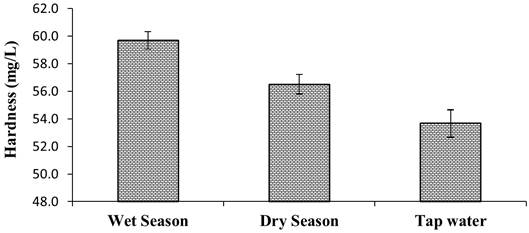
Figure 6. Mvutjini earth dam water hardness.
The results indicated that the dam water hardness met the WHO guideline value less than five hundred milligrams per litre (< 500 mg/L). However, the mean hardness during the Wet Season (59.7 mg/L) was close to the guideline values indicating that periodic quality analysis ought to be done to monitor the dam water quality because the potential pollution exists.
4. Conclusions
The Physical quality of the dam water with respect to pH and turbidity was assessed and found to be acceptable. The results indicated that the mean pH for the Mvutjini dam water was 7.45, 7.31 and 6.80 for the Wet Season, Dry Season and the treated SWSC tap water (control), respectively. The pH was significantly different between the seasons; the same was true between the seasons and the SWSC treated tap water. This could be attributed to runoff driven faecal matter to the dam during the Wet Season. The results reflected that the mean turbidity of the Mvutjini earth dam water was significantly different between the seasons. It was higher (0.96 NTU) during the Wet season (0.55 NTU) than in the Dry season. This scenario could be attributed to the runoff prevalent during the wet seasons after rainfall events. It can be concluded that the turbidity of the Mvutjini dam water was less than the guideline value for domestic water, which is 5 NTU.
The bacteriological water quality of the Mvutjini dam with respect to Total coliforms and faecal coliforms (E. coli) was assessed. The results indicated that during the wet season the mean total coliforms were 3654 counts per 100 ml, while during the Dry Season the mean total coliforms were 2420 counts per 100 ml. It can be concluded that the Mvutjini earth dam reservoir water had poor bacteriological water quality since it had the mean E. coli of 3433 counts/100 ml after rainfall and 2100 counts/100 ml during the dry period. Both means were above the WHO guidelines which state that there should be no E. coli present in drinking water samples. It was concluded that the Mvutjini dam reservoir water was heavily polluted with E. coli. This implies that the water is a potential threat to human health, particularly those using the water for domestic water purposes.
The chemical quality with respect to nitrates and hardness were negligible. The mean nitrates during the dry period were 7.2 mg/L and it was 9.8 mg/L in the Wet Season. The amount of nitrates present in all the water samples was below the WHO water quality guideline which state that the amount of nitrates in water should be below 10 mg/L. The results reflected that the mean hardness of the Mvutjini dam water was 59.7 mg/L, 56.5 mg/L and 53.7 mg/L for the Wet Season, Dry Season and the SWSC treated tap water, respectively. The results indicated that the dam water hardness met the WHO guideline value less than five hundred milligrams per litre (< 500 mg/L). However, the mean hardness during the Wet Season (59.7 mg/L) was close to the guideline values indicating that periodic quality analysis ought to be done to monitor the dam water quality because the potential pollution exists.
References
- AfroGIS (2008). Biophysical environmental analysis and Land use mapping of Makhondvolwane earth dam report. http://www.gwp.org/global/toolbox/case%20studies/Africa/Swaziland%20application%20of%20a%20iwrm%20at%20a%20community%20level/at kalanga 358.pdf. Accessed November, 2016.
- Ahmed, R. (2010). Drinking water contamination and its effects on human health http://www.cwrv.edu/med/epidbio/mphp439/drinking.water pdf. Accessed on 13/10/2015.
- Alberta Environment and Park (2015). Impacts of land use on water. http://esrd.alberta.ca/water/education-guidelines/impact of land-use on wateraspx. Accessed October, 2016.
- British Dams, (Undated). About dams. http://www.britishdams.org/about dams/gravity.html Accessed September, 2016.
- Cabral, J. P. S., (2010). Water Microbiology. Bacterial Pathogen Water. http://www.ncbi.nlm.nih.gov/pmc/articles/pmc2996186/pdf. Accessed on 12/10/2015.
- Caldwell, K. (2006). Sampling procedure. http://www.ikcaldwell.com.au/downloads/sampling procedureguidelines.pdf. Accessed October, 2016.
- Department of Water Affairs and Forestry, (2000). Quality of Domestic water supplies volume 2.Sampling guide. http://www.dwa.gov.za/iwqs/Assessment guide/samplingGuide.pdf. Accessed November, 2016.
- Elbag, M. (2006). Impact of Surrounding Land Uses on Surface Water Quality.
- EPA, (2007). National Management Measures to Control Nonpoint Source Pollution from Hydromodification. http://www.epa.gov/sites/production/files/2015/docu ment/chapter 4.dam web.pdf. Accessed October, 2016.
- EPA, (2013). Basic information about disinfectants in drinking water. http://cdc.gov.healthywater/drinking/public use. Accessed on 27/04/2016.
- Grady, C. A.; Weng, S. and Blatchley, E. R. (2014). Global portable water: Current status, critical problems and future perspectives. Hand book of environmental chemistry. Springer International Publishing, Switzerland. www.springer.com. Accessed December, 2016.
- FEMA, (2015). Benefits of dams. Federal Emergency Management Agency http://www.fema.gov/benefits-dams. Accessed November, 2016.
- Government of Swaziland (2016). Swaziland Humanitarian needs overview. UN office for coordination of humanitarian affairs. http://reliefweb.int/report/Swaziland_Humanitarian_needs_overview. Accessed October, 2016.
- Hatch company, (1999). Hatch method 8195. Determination of turbidity by Nephelometry. Revision 2.0. Hach Company 5600. Colorado, USA. www.hach.com/asset-get.downloaden.jsa?code=97811. Accessed November, 2016.
- Mc Cully, P. (undated) Silenced Rivers: The Ecology and Politics of Large Dams. http://www.internationalrivers.org/dams-and-water-quality. Accessed October, 2016.
- Mishra, D. D. (2010). Fundamental concepts in environmental studies. S. Chand and Company. PTY. LTD. New Delhi.
- Mylavarapu, R. (2014). Impacts of phosphorus on water quality. IFAS extensuion, University of Florida. www.edis.ifas.ufl.edu. Accessed December, 2016
- Panigrahi, A. K.; Chaoudhury, N. and Tarafdar, J. (2014). Pollution impact of some selective agricultural pesticides on fish cyprinus capiro. International Journal of Research in Applied Natural and Social Sciences. 2: 71 – 76. www.impactjournals.us. Accessed November, 2016.
- Saleem, M.; Iqbal, J. and Shah, M. H. (2015). Assessment of water quality for drinking/irrigation purpose from Mangla dam, Pakistan. Geochemistry: Exploration, Environment, Analysis. http://geea.geoscienceworld.org/content/early/2015/09/15/geochem2014-336. Accessed December, 2016
- Tortajada, C. (2014). Dams: An essential component of development. American Society of Civil Engineers. South Wales University. www.thirdcentre.org. Accessed November, 2016.
- WHO, (2008). Guidelines for Drinking-Water quality, Third edition incorporating the second addenda, Volume 3, Geneva. http://www.who.int/water-sanitation health/dwg/full text.pdf. Accessed on October, 2016.
- WHO. (2010) Hardness in drinking water. Background document for development of WHO guidelines for drinking water quality; 2010 Accessed 25 April, 2013. www.who.int/water_sanitation_health/dwg/chemicals/hardnes s.pdf. Accessed November, 2016.


