
Journal of Agricultural Science and Engineering, Vol. 2, No. 6, December 2016 Publish Date: Jan. 9, 2017 Pages: 57-65
Water Quality Assessment Upstream of the Great Usuthu River in Swaziland
Bruce Roy Thulane Vilane*, Lungelo Tembe
Department of Agricultural and Biosystems Engineering, Faculty of Agriculture, University of Swaziland, Luyengo Campus, Swaziland
Abstract
Rivers are the most important sources of surface water. However their quality is a function of the catchment activities. A study was conducted to investigate river water upstream of the Great Usutu River in Swaziland. The study was an experiment with one treatment; the Great Usutu river water, with two replications. World Health Organization water quality guidelines for domestic water use were used as a control. Water samples were taken from three samplings stations or sites, at Bunya, Lamgabhi and Mhlabubovu. The sampling took place in February 2016, which was a rainy season. The samples were collected in the morning and taken for testing Physical (turbidity and pH), Microbiological (E. coli) and chemical (nitrates, hardness and phosphorus) quality on the same. Data analysis was conducted using one-way ANOVA utilizing SPSS computer software (version 20). The results indicated that the physical water quality (mean turbidity) at Bhunya, Lamgabhi and Mhlabubovu were 265.5 NTU, 209.5 NTU and 129.5 NTU, respectively. The turbidity levels were above the WHO guideline value of 5 NTU, while the mean pH levels at Bhunya, Lamgabhi and Mhlabubovu were 7.43, 7.27 and 7.90, respectively. The pH levels were within the WHO water quality guidelines value of 6.5-8.5. The microbiological water quality in terms of the mean E. coli at Bhunya, Lamgabhi and Mhlabubovu were 2538.0 counts/100 ml, 2015.5 counts/100 ml and 1521.5 counts/100 ml, respectively. The river was contaminated with E. coli given the fact that the WHO water quality guideline value for domestic water use is 0 counts/100 ml of E. coli. The chemical water quality in terms of the mean nitrates at Bhunya, Lamgabhi and Mhlabubovu was 0.02 mg/L, 0.06 mg/L and 0.18 mg/L, respectively. The nitrates in the river water were within the WHO water quality guidelines for domestic use (10 mg/L). The mean hardness on the other hand was 240 mg/L, 950 mg/L and 1100 mg/L at Bhunya, Lamgabhi and Mhlabubovu, respectively, while the mean river water phosphorus was 1.40 mg/L, 1.70 mg/L and 2.81 mg/L at Bhunya, Lamgabhi and Mhlabubovu, respectively. It was concluded that the river water upstream of the Great Usuthu River was polluted on the basis of the microbiological quality (E. coli) and chemical (hardness, and phosphorus) reflected above.
Keywords
Assessment, Water Quality, Upstream, Great Usuthu River, Swaziland
Received: November 11, 2016
Accepted: December 21, 2016
Published online: January 9, 2017
@ 2016 The Authors. Published by American Institute of Science. This Open Access article is under the CC BY license. http://creativecommons.org/licenses/by/4.0/
Contents
1. Introduction
Rivers and streams are the most important sources of surface water that provides nourishment to life forms in both urban and rural environments. Water should be available where there is human settlement for food preparation, industrial application, washing, cleaning and other uses. An adequate supply of water is a prerequisite for significant socio-economic development of a community (Sanctuary, 2007). Adequate water supply can help activities such as fruit and vegetable growing, livestock keeping and fish farming, which can improve the socio economic status of the community (Coompson, 2014). Safe drinking water and basic sanitation is of crucial importance to the preservation of human health, especially among children (World Water Council, Undated).
About 1.7 billion people survive without proper sanitation, and the health of three billion people in the world is affected by pollution and poor sanitation (WHO, 2015; CDC, 2016; UN, 2016a). Contaminants such as bacteria, viruses, heavy metals, nitrates and salt have polluted water supplies as a result of inadequate treatment and disposal of waste from humans and livestock, industrial discharges and overuse of limited water resources (Singh and Mosley, 2003; Nsor et al., 2016). Water resources management is essential in maintaining quality water. Increasing industrialization and the growth of large urban centres have been accompanied by an increase in the pollution stress on the aquatic environment (UN, 2016b). The aquatic environment is especially affected by sediment volumes. Suspended solids have direct and complex indirect effects on aquatic biota. Organisms are either affected by solids in suspension or after deposition as bed load sediment or by both.
According to Anonymous, (2016), physical processes affect water in its vapour, liquid, and solid states, not only in the atmosphere but also in the soil rock and in exposed water, streams, lakes and glaciers. Each year the world generates perhaps 5-10 billion tons of industrial waste, a lot of which is pumped untreated into rivers, oceans and other waterways (Woodford, 2015). Even if no anthropogenic sources of contamination exist, there is the potential of natural levels of metals and other chemicals to be harmful to human health (Akpoveta et al., 2011; Tornero and Hanke, 2016). Water pollution has been documented as a major contributor to a lot of health problems in humans and marine animal ecosystems. According to the WHO (2014), almost one tenth of the global disease burden could be prevented by improving water supply, sanitation, hygiene and the management of water resources.
Swaziland has five major river systems. These are Nkomati, Mbuluzi, Lomati, Ngwavuma and the Great Usutu River. Four of these originate in South Africa; flow through Swaziland, then to Mozambique and finally emptying into the Indian Ocean. Out of all the river water sources of the country, 42% of the water originates from South Africa, while 58% originates within the country (Mwendera et al., 2002).
The source of the Great Usutu River is in South Africa, on the Drakensburg Mountains in the Mpumalanga Province. The river flows in an easterly direction and enters Swaziland, where it meanders for about 202 km until it forms a border between South Africa and Swaziland (Lebombo mountains). It then flows north-eastward to enter Delagoa Bay, which is south-east of the city of Maputo, then finally empty itself in the Indian Ocean. The main tributaries of the Great Usutu River in Swaziland are the Lusushwana, Mkhondvo, and the Ngwempisi River. The river water is used for irrigation, livestock watering, domestic purposes, industrial, fish farming and tourism purposes (Government of Swaziland, 2003). This array of uses demands different quality of the river water and by extension periodic water quality analysis.
Water quality analysis is one of the most important aspects in surface water studies and it is a critical factor for assessing the pollution level (Singh and Shrivastava, 2015). According to Saleem et al (2015) the quality of surface water is a very sensitive issue. However, water is not evenly distributed all over the world and even its availability at the same locations is not uniform over the year (Anonymous, 2015). It is broadly accepted that the most appropriate unit for water resources development and management is the catchment (Shadeed and Lange, 2010). River water quality is thus highly driven by the catchment activities, particularly where the water is used for domestic purposes by downstream users.
Anthropogenic influences (urban, industrial and agricultural activities, increasing consumption of water resources) as well as natural processes (changes in precipitation inputs, erosion, weathering of crustal materials) degrade surface waters and impair their use for drinking, industrial, agricultural, recreation or other purposes (Carpenter et al, 1998; Jarvie et al., 1998). The degradation of water may occur due to change in quality caused by contamination or pollution so that it becomes unsuitable to users (Antoniou et al., 2005; Stewart, 2016). This degradation is more on rivers and streams which flows through potential sources of pollution. The Great Usutu River in Swaziland is one of such rivers. It flows through the town of Bunya, which has catchments associated with urban and rural land use activities within its boundaries. It flows though Lamgabhi and Mhlabubovu, which are rural areas where crops are grown and livestock raised. These catchment activities could degrade the quality of the river, hence this study.
Objectives
i. To assess the physical water quality (turbidity and pH) upstream of the Great Usutu River.
ii. To determine the microbiological water quality (E. coli.) upstream of the Great Usutu River.
iii. To assess the chemical water quality (nitrates, hardness and phosphorus) upstream of the Great Usutu River.
2. Methodology
2.1. Description of the Study Area
Bunya, Lamgabhi and Mhlabubovu are situated in the west of Swaziland under the Manzini administrative region. The areas are located in the Highveld, within the coordinates 26˚33’0" S and 31˚1’0" E with a population of 14 970 people. The main industrial activity is the production of planks, located in the same area where the Sappi Usutu Pulp Company was based at Bunya. The Great Usuthu River catchments at Lamgabhi and Mhlabubovu sampling stations has rural land use activities, comprising crop production as well as livestock production at subsistence scale.
2.2. Research Design
The research was an experiment, whereby the World Health Organisation guidelines for drinking water quality were used as a control. There was one treatment, the river water upstream of the Great Usuthu River, with two replications.
2.3. Water Sampling
A grab sampling technique was used, where samples were taken at depths of approximately 20 cm from the water surface since the sampling stations or sites were accessible (Figure 1). River water samples were taken on three sites along the Great Usutu River. The first site was at Bunya, near the pulp mill, at coordinates 26°32'0.54" S and 31°00'43.66" E. The second site was at Lamgabhi at the gauging spot, with coordinates 26°34'11.21" S and 31°05'00.02" E. The last site was at Mhlabubovu, at coordinates 26°35'29.02" S and 31°06'49.17"E.

Figure 1. Great Usutu River catchment areas along the sampling points.
Twelve samples were collected in total, two samples were taken in each sampling site for each parameter (physical, biological and chemical). Samples were taken on 12 February, 2016 between 9:00 hrs. and 11:00 hrs. Sterilized 500 ml polyethylene bottles obtained from the Swaziland Water Services Corporation (SWSC) laboratory were used for sampling.
2.4. Data Collection and Analysis
To avoid decomposition, the river water samples upstream of the Great Usuthu River were transported to the SWSC laboratory in a cooler box with ice cubes on the same day. The samples were tested for physical, chemical, and microbiological quality. The results were entered into SPSS (version 20.0) computer software utilizing one-way ANOVA. The World Health Organisation water quality guidelines were used to compare the concentration of the tested parameter.
2.4.1. Physical Quality Analysis Methods
The physical quality analysis involved performing tests for turbidity and pH in the water samples collected.
i. Turbidity
Turbidity was determined using the Absorptometric Method, adopted from FWPCA methods for chemical analysis of water and wastes, 275 (1969). The spectrophotometer wavelength was rotated until the small display showed 450 nm and 25 ml of the sample when placed into the cell holder (Hatch company, 1999). The turbidity guideline value for domestic water is 5 NTU (WHO, 2008).
ii. pH
The pH is the most significant physical parts that change the chemical and biological effect in the river water (Sivamanikandan and Ahmed, 2016). The table pH meter was used to measure the pH of the water upstream of the Great Usutu River. The electrode was immersed in the sample. Readings were taken after 20-30 seconds after the water readings have stabilized. The electrode was rinsed with distilled water and then wiped to dry. The pH guideline value for domestic water is 6.5 – 8.5 (WHO, 2008).
2.4.2. Microbiological Quality Analysis Methods
The microbiological quality analysis involved performing tests for faecal coliforms (E. coli) in the water samples collected upstream of the Great Usuthu river.
Faecal coliforms
The term ‘faecal coliforms’, although frequently employed, is not correct: the correct terminology for these organisms is ‘thermotolerant coliforms’. Thermotolerant coliforms are defined as the group of total coliforms that are able to ferment lactose at 44 - 45°C. They comprise the genus Escherichia and, to a lesser extent, species of Klebsiella, Enterobacter, and Citrobacter. Out of these organisms, only E. coli is considered to be specifically of faecal origin, being always present in the faeces of humans, other mammals, and birds in large numbers and rarely, if ever, found in water or soil in temperate climates that has not been subjected to faecal pollution.
The analysis of faecal coliform was performed using deionized distilled water with the growth medium being 50 g m-FC broth and 100 ml water. The broth was boiled. During the boiling of the broth, constant stirring was done to avoid burning of the undissolved media. The broth was poured into a 47 mm filter culture plates. Upon testing using the membrane filtration procedure, all green colonies were counted and the results presented as faecal coliforms per 100 ml. The E. coli guideline value is 0 counts/100 ml for domestic water (WHO, 2008).
2.4.3. Chemical Quality Analysis Methods
i. Nitrates
The standard diazotization method using powder pillows was used to determine the amount of nitrates in the water samples. The nitrates guideline value for the amount of nitrates in domestic water is 10 mg/L (WHO, 2008).
ii. Hardness
Total hardness is dependent upon the quantity of calcium or magnesium salts (APHA 1998; Adejuwon and Adelakun, 2012). Excessive hard water cause excessive soap consumption, whilst soft water tends to be corrosive. Higher levels may cause incrustation of utensils and pipe works. Concentrations greater than 500 mg/L are considered undesirable for domestic use. Total hardness of the river water samples upstream of the Great Usutu River was measured by Ethylene diamine tetra acidic acid (EDTA) titration method.
iii. Phosphorus
Phosphorus in natural waters is usually found in the form of (PO4-3) phosphates (Murphy, Undated). Phosphorus is an important nutrient that can be in various oxidized forms; however its elevated levels in surface waters can cause eutrophication (Guergueb et al, 2015). Phosphorus is an element responsible for the eutrophication of inland and marine aquatic environments (Boussaha and Laifa, 2016). Eutrophication is a natural very slow process by which water bodies receives large amounts of nutrients including phosphorous, which stimulates the growth of algae and aquatic plants. According to Tappin et al. (2016) excess dissolved phosphorus (as orthophosphate-P) contributes to reduced river water quality within Europe and elsewhere. The maximum acceptable amount of phosphorus to avoid accelerated eutrophication is 0.1 mg/L (EPA, 1986).
The ascorbic acid method described by the Environmental Protection Agency (Undated) was used to determine phosphorus in the river water upstream of the Great Usuthu River. A combined liquid consisting of sulphuric acid, potassium antimonyl tartrate, ammonium molybdate and ascorbic acid was added to 50 ml sample of the water upstream of the Great Uusthu River. This coloured the sample blue in the direction proportional to the amount of orthophosphate in the sample. Transmittance was then measured after 10 minutes, but before 30 minutes, using a color comparator with a scale in milligrams per liter that increased with the increase in color hue.
3. Results and Discussion
3.1. Physical Water Quality Results
i. Turbidity
The results in Table 1 indicated that in all the water samples collected at Bhunya, Lamgabhi and Mhlabubovu, the turbidity ranged from 122 NTU to 278 NTU.
Table 1. Turbidity of the river water upstream Great Usuthu River.
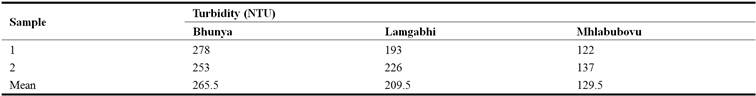
The mean turbidity of the water upstream of the Great Usuthu River at Bhunya was 265.5 NTU. At Lamgabhi and Mhlabubovu the mean turbidity was 209.5 NTU and 129.5 NTU, respectively. The water turbidity in all the three sampling sites was above the World Health Organisation guidelines of 5 NTU for domestic use. The results in Table 2 indicated that the mean turbidity of the water upstream of the Great Usuthu River was not significantly different (P> 0.05) between Bhunya and Lamgabhi, while it was significantly different (P< 0.05) between Bhunya and Lamgabhi. This could be attributed to the different catchment activities in these sampling stations.
Table 2. Upstream Great Usuthu River Turbidity analysis of variance.
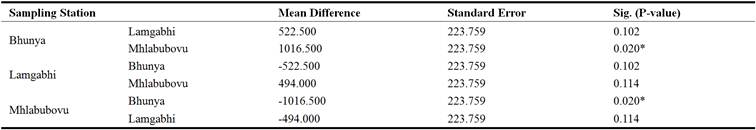
*The mean difference is significant at 0.05
ii. pH
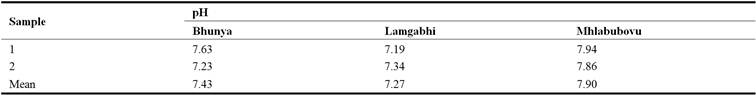
The results indicated that in all the river water samples collected at Bhunya, Lamgabhi and Mhlabubovu the pH values ranged from 7.19 – 7.94 (Table 3). The mean pH in the water upstream of the Great Usuthu River at Bhunya, Lamgabhi and Mhlabubovu were 7.43, 7.27 and 7.90, respectively.
Table 3. Upstream Great Usuthu River water pH.
The results indicated that the mean pH detected were significantly different (P < 0.05) from each other at Lamgabhi and Mhlabubovu. The river water pH was within the acceptable WHO water quality guidelines value of 6.5 – 8.5 for domestic use. Measuring the river water pH was important in determining the corrosive levels of water. Water with a low pH has a high level of corrosion.
The mean separation results in Table 4 reflected that the Great Usuthu River water pH at Lamgabhi and Mhlabubovu were not significantly different (P< 0.05). However, at Mhlabubovu the pH of the water upstream of the Great Usuthu River was not significantly different (P>0.05) from the river water pH at Bhunya. This trend was also true between the river water pH at Bhunya and Lamgabhi.
Table 4. Upstream Great Usuthu river water pH analysis of variance.
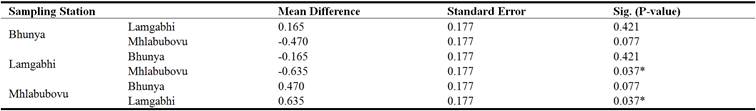
* The mean difference is significant at 0.05
3.2. Microbiological Water Quality Results
The results in Table 5 reflected that in all the river water samples collected at Bhunya, Lamgabhi and Mhlabubovu, E. coli was detected and it ranged from 1436 counts /100 ml to 2794 counts/100 ml. The mean E. coli in the water upstream of the Great Usuthu River at Bhunya was 2538.0 counts/100 ml, while at Lamgabhi it was 2015.5 counts/100 ml and it was 1521.5 counts/100 ml at Mhlabubovu.
Table 5. E. coli concentrations of the river water upstream of the Great Usuthu River.
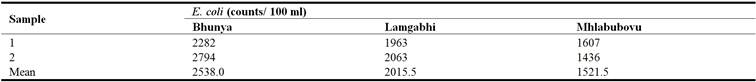
The results indicated that the mean E. coli detected in the river water were significantly different (P < 0.05) at Bhunya and Mhlabubovu. The river was heavily contaminated by E. coli given the fact that the WHO water quality guideline for domestic use is 0 counts/100 ml. This faecal contamination could be attributed to the livestock farming around Bhunya, Lamgabhi and Mhlabubovu.
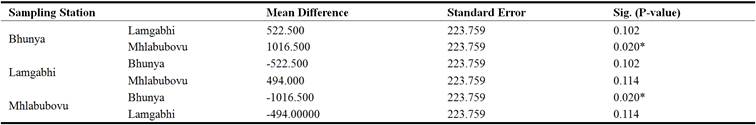
The mean microbial concentration of the water upstream of the Great Usuthu River was significantly different (P<0.05) between Bhunya and Mhlabubovu, while it was not significantly different (P>0.05) Bhunya and Lamgabhi (Table 6). This could be attributed to the different land use activities in the two river catchments; Bhunya is primarily an industrial town, while Mhlabubovu is a rural area with rural land use in the form of crop and livestock production.
Table 6. Upstream Great Usuthu River microbiological (E. coli) analysis of variance.
* The mean difference is significant at 0.05
The livestock production could be the sources of the microbiological (E. coli) contamination. The Mhlabubovu sampling station catchment has the same land use, but it was not significantly different, probably due to cumulative effect, since it is after the Lamgabhi sampling station.
3.3. Chemical Water Quality Results
i. Nitrates
The results in Table 7 indicated that the nitrates in the water upstream of the Great Usuthu River at Bhunya, Lamgabhi and Mhlabubovu ranged between 0.01 mg/L and 0.20 mg/L.
Table 7. Nitrates of the river water upstream of the Great Usuthu River.
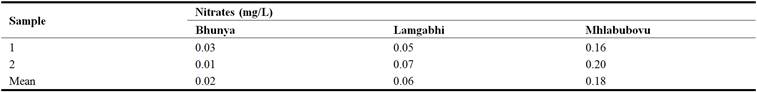
The results reflected that the mean nitrates concentration in the water upstream of the Great Usuthu River at Bhunya was 0.02 mg/L, while at Lamgabhi and Mhlabubovu the mean nitrates concentration were 0.06 mg/L and 0.18 mg/L, respectively. The mean nitrates were significantly different (P < 0.05) at Bhunya and Mhlabubovu as well as at Mhlabubovu and Lamgabhi. This could be attributed to the agricultural and industrial activities in these areas. However, the nitrates concentration in the river was within the WHO water quality guidelines for domestic use (10 mg/L).
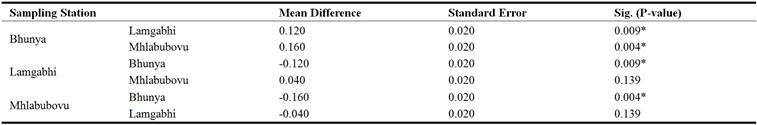
The results in Table 8 reflected that the mean nitrates concentration in the water upstream of the Great Usuthu River was not significantly different (P> 0.05) between Lamgabhi and Mhlabubovu. However, Bhunya and Mhlabubovu were significantly different (P< 0.05) as well as between Bhunya and Lamgabhi. This could be attributed to the river catchment activities, which are both rural land use (crop and livestock production). The river flows past Bhunya to Lamgabhi and Mhlabubovu as such the nitrates sources from the catchments could build up as the river flows.
Table 8. Upstream Great Usuthu River nitrates analysis of variance.
* The mean difference is significant at 0.05
The river catchments at the sampling stations at Bhunya, Lamgabhi and Mhlabubovu are largely rural land use consisting of agricultural production in addition to the industrial activities at Bhunya. These are mainly crop production, where fertilisers and kraal manure is used to improve soil fertility and livestock are kept at subsistence scale
ii. Hardness
Hardness is the amount of calcium carbonate equivalent per litre (WHO, 2010). It measures the capacity at which water will react with soap. Hard water will require more soap to reduce lather. However, water containing calcium carbonate at concentration of < 60 mg/L is soft. The results indicated that the hardness of the water upstream of the Great Usutu River ranged from 230 mg/L to 1110 mg/L in the three sampling stations or sites (Table 9).
Table 9. Hardness upstream of the Great Usuthu River water.
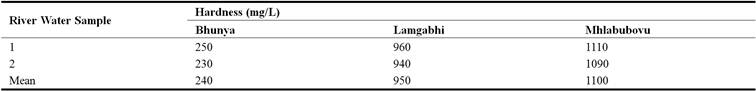
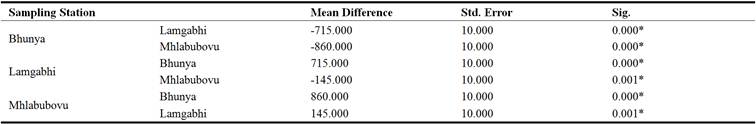
The results in Table 10 reflected that the mean hardness of the water upstream of the Great Usuthu River was significantly different (P< 0.05) in all the sampling stations (Table 10).
Table 10. Upstream Great Usuthu River hardness analysis of variance.
*. The mean difference is significant at the 0.05 level.
The sampling station at Bhunya had water whose mean hardness was significantly different (P<0.05) to both the river water upstream of the Great Usuthu River at Lamgabhi as well as Mhlabubovu and it was the same Between Lamgabhi and Bunya as well as Lamgabhi and Mhlabubovu. This could be attributed to the differences in land use characteristic of the catchments at these sampling stations. Though the Lamgabhi and Mhlabubovu sampling stations have relatively the same catchment land uses (crop and livestock production), the Mhlabubovu sampling station comes after the Lamgabhi sampling station. This scenario could lead to the cumulative hardness in the water upstream of the Great Usuthu River at Mhlabubovu, hence the significant difference.
iii. Phosphorus
The results indicated that there was phosphorus detected in all the water sampled upstream of the Great Usutu River (Table 11). The phosphorus ranged from 1.30 mg/L at Bunya to 2.84 mg/L at Mhlabubovu.
Table 11. Phosphorus in the river water upstream of the Great Usuthu River.
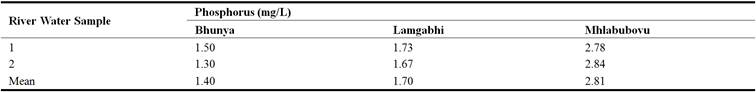
The mean river water phosphorus was 1.40 mg/L, 1.70 mg/L and 2.81 mg/L at Bunya, Lamgabhi and Mhlabubovu, respectively. This trend was similar to the hardness as shown in Table 9. These concentrations were higher than the 0.1 mg/L guideline value recommended by the EPA (1996); Water Research Centre (2014) to avoid eutrophication.
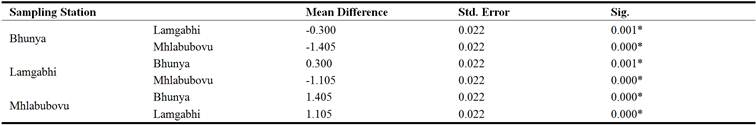
The results in Table 12 reflected that the mean Phosphorus of the water upstream of the Great Usuthu River was significantly different (P< 0.05) in all the sampling stations (Table 12).
Table 12. Upstream Great Usuthu River phosphorus analysis of variance.
*. The mean difference is significant at the 0.05 level
The sampling station at Bhunya had water whose mean Phosphorus was significantly different (P<0.05) to both the river water upstream of the Great Usuthu River at Lamgabhi and Mhlabubovu and it was the same case in all the sampling stations (Lamgabhi and Mhlabubovu. It is worth noting that the river water flows from Bhunya, which has different land use to Lamgabhi and eventually through Mhlabubovu. Both Lamgabhi and Mhlabubovu have relatively the same catchment land uses i.e. crop and livestock production. As such the phosphorus in the water upstream of the Great Usuthu River at Mhlabubovu could be significant different to the other stations due to the cumulative effect.
The eutrophication situation of the Great Usutu River can be observed by the high values of phosphorus that exceed the standards of the surface water’s quality. In general terms, the water quality upstream of the Great Usutu River that was affected by this phenomenon is bad and it may cause an ecosystem disturbance. Eutrophication is a natural very slow process by which water bodies receives large amounts of nutrients including phosphorous, which stimulates the growth of algae and aquatic plants. The agricultural activities at Mhlabubovu and Lamgabhi as well as the industrial activities at Bunya are the main sources of the phosphorus.
4. Conclusions
The physical water quality of the water upstream of the Great Usutu River was assessed by measuring turbidity and pH. The mean river water turbidity at Bunya, Lamgabhi and Mhlabubovu were 265.5 NTU, 209.5 NTU and 129.5 NTU, respectively. The mean river water pH at Bunya, Lamgabhi and Mhlabubovu were 7.43, 7.27 and 7.90, respectively. The river water pH was within the WHO guidelines for domestic use (6.5-8.5). The turbidity levels were above the WHO guideline value for domestic use of 5 NTU. It was concluded that the physical water quality of the water upstream of the Great Usuthu River was not acceptable due to the turbidity, which was above the WHO guidelines.
The microbiological quality of the water upstream of the Great Usutu River was assessed by measuring E. coli. The mean river water E. coli for Bunya, Lamgabhi and Mhlabubovu were 2538.0 counts/100 ml, 2015.5 counts/100 ml and 1521.5 counts/100 ml, respectively. The river water E. coli were above the WHO guideline value for domestic use of 0 counts/100 ml. On the basis of the above results it was concluded that the water upstream of the Great Usutu River at Bunya was polluted with faecal matter.
The chemical water quality of the water upstream of the Great Usutu River as evident from the nitrates, hardness, and phosphorus reflected unacceptable levels of pollution. The mean nitrates concentration at Bhunya, Lamgabhi and Mhlabubovu was 0.02 mg/L, 0.06 mg/L and 0.18 mg/L, respectively. The mean nitrate concentration at Bhunya and Mhlabubovu were 0.02 mg/L and 0.06 mg/L, respectively. The nitrates concentration in the river was within the WHO quality guideline value for domestic use (10 mg/L). The hardness of the river water upstream of the Great Usutu River ranged from 230 mg/L to 1110 mg/L in the three sampling stations. The phosphorus on the other hand ranged from 1.30 mg/L at Bunya to 2.84 mg/L at Mhlabubovu. These concentrations were higher than the 0.1 mg/L guideline value to avoid eutrophication, indicating that there was eutrophication in the water upstream of the Great Usutu River. It was concluded that the chemical quality of the water upstream of the Great Usuthu River was polluted due to the phosphorus, which was above the guideline value.
References
- Adejuwon, J. O., and Adelakun, M. A. (2012). Physiochemical and bacteriological analysis of surface water in Ewekoro Local Government Area of Ogun State, Nigeria. Int. J. Water. Res. Environ. Eng., 4 (3): 66-72.
- Akpoveta, O. V.; Okoh, B. E. and Osakwe, S. A. (2011). Quality Assessment of Borehole water in the Vicinity of Benin Edo State and Agbor, Delta State of Nigeria.Current Research in Chemistry ; 3 (1) 62-69.
- Anonymous, (2015). Benefits of large dams. http://bbmb.gov.in/english/benefit_large_dam.asp. Accessed October, 2016.
- Anonymous, (2016). Water quality control: Part 1 – introduction to water quality, hydrological circle, properties of water, sea environment, Baltic Sea. http://www.pg.gda.pl/chem/Dydaktyka/Analityczna/WQC/wqc_p1.pdf. Accessed December, 2016.
- Antoniou, M. G.; Armah, A.; De La Cruz, A. A. and Dionysios, D. D. (2005) Cyanotoxins: New generation of water contaminants. Journal of environmental engineering 131.9 (2005): 1239-1243.
- APHA. (2005). Standard Methods for Examination of Water and Wastewater, 21st edn, American Public Health Association, Washington DC, USA.
- Boussaha, S. and Laifa, A. (2016). Quantitative evaluation of phosphorus dissolved in the water of Bounamoussa River (North Eastern Algeria). Journal of Chemical and Pharmaceutical Research, 8 (2): 505-512. http://www.jocpr.com/articles/quantitative-evaluation-of-phosphorus-dissolved-in-the-water-of-bounamoussa-river-north-eastern-algeria.pdf. Accessed November, 2016.
- Carpenter, S. R; Caraco, N. F.; Correll, D. L.; Howarth, R. W.; Sharpley, A. N. and Smith, V. H. (1998). Nonpoint pollution of surface waters with phosphorus and nitrogen. Ecol Appl 1998; 8 (3): 559–68.
- CDC, (2016). Global WASH Fast Facts. http://www.cdc.gov/healthywater/global/wash_statistics.html. Accessed December, 2016.
- Coompson, J. A. (2014). Global Agriculture and Food Security Program (GAFSP) - Agriculture Productivity and Market Enhancement Project (APMEP). Ministry of Agriculture- Water development. Government of Zambia. http://www.afdb.org/en/projects-and-operations/project-portfolio/project/p-zm-aa0-019/. Accessed December, 2016.
- Environmental Protection Agency (Undated). 5.6 Phosphorus. The United Staes Environmental Protection Agency (EPA). https://archive.epa.gov/water/archive/web/html/vms56.html Accessed November, 2016.
- EPA, (1986) National Recommended Water Quality Criteria - Aquatic Life Criteria Table : https://www.epa.gov/wqc/national-recommended-water-quality-criteria-aquatic-life-criteria-table. Accessed November, 2016.
- Guergueb, S.; Laifa, A.; Djamai, R. and Fadel, D. (2015). Concentration study level of nitrogen and mineral phosphorus eutrophication and impact of the mouth of Wadi El-Kebir East (W.EL-TARF) Journal of Chemical and Pharmaceutical Research, 2015, 7 (9): 602-608. http://textlab.io/doc/14986449/concentration-study-level-of-nitrogen-and-mineral-phospho. Accessed November, 2016.
- Government of Swaziland, (2003). Water Use Registry. Ministry of Natural Resources and Energy, Swaziland Government. Mbabane, Kingdom of Swaziland
- Hatch company, (1999) Hatch method 8195. Determination of turbidity by Nephelometry. Revision 2.0. Hach Company 5600. Colorado, USA. www.hach.com/asset-get.downloaden. jsa?code=97811. Accessed November, 2016.
- Jarvie, H. P.; Whitton, B. A. and Neal, C. (1998) Nitrogen and phosphorus in east coast British rivers: speciation, sources and biological significance. Sci. Total Environ 1998; 210 - 211: 79 -109.
- Murphy, S. (Undated). Basin: General Information on Phosphorus. City of Boulder/USGS Water Quality Monitoring. http://bcn.boulder.co.us/basin/data/BACT/info/TP.html. Accessed November, 2016.
- Mwendera, E. J; Manyatsi, A. M; Magwenzi, O and Dlamini, S. M. (2002). Swaziland Water Demand Management Country Study Report. Water Demand Management Program for Southern Africa phase II. Pretoria IUCN.
- Nsor, C. A.; Acquah, E. and Braimah, C. A. (2016). Seasonal Dynamics of Physico-chemical Characteristics in Wetlands of Northern Region (Ghana): Implications on the Functional Status. International Journal of Aquatic Science: 2008-8019. Vol. 7, (1) 39-49. http://www.journal-aquaticscience.com/2016%20(1)/Nsor%20et%20al.%20(2016)1.pdf. Accessed December, 2016.
- Saleem, M.; Iqbal, J. and Shah, M. H. (2015). Assessment of water quality for drinking/irrigation purpose from Mangla dam, Pakistan. Geochemistry: Exploration, Environment, Analysis. http://geea.geoscienceworld.org/content/early/2015/09/15/geochem2014-336. Accessed December, 2016
- Sanctuary, M. (2007). Making water part of economic development: The economic benefits of improved water management and services. http://www.who.int/water_sanitation_health/waterandmacroecon.pdf. Accessed November, 2016.
- Shadeed, S. and Lange, J. (2010). Rainwater harvesting to alleviate water scarcity in dry conditions: A case study in Faria Catchment, Palestine. Water Science and Engineering. 3 (2): 132-143. http://www.sciencedirect.com/science/article/pii/S167423701530106X. Accessed November, 2016.
- Singh, S. and Mosley, L. M. (2003). Trace elements levels in drinking water on Viti Levu, Fiji Islands. S. Pac. Nat. Sci., 21: 21-34.
- Singh, P. K. and Shrivastava, P. (2015). Analysis of water quality of River Narmada. International Journal of Current Research 7 (12). 24073-24076. http://www.journalcra.com/sites/default/files/12343.pdf. Accessed November, 2016
- Sivamanikandan, P. and Ahmed, A. J. (2016). Physical and chemical analysis of mullaiperiyar river water in Theni district, Tamilnadu, IndiaInt.J.Curr.Microbiol.App.Sci (2016) 5 (2): 173-180. http://www.ijcmas.com/5-2-16/P.Sivamanikandan%20and%20S.Ahmed%20john.pdf. Accessed November, 2016.
- Stewart, R. E. (2016). Agricultural technology: the effects of pollution. https://www.britannica.com/technology/agricultural-technology/The-effects-of-pollution. Accessed December, 2016.
- Strahler, A. H. and Strahler, A. (1997). Physical geography science and systems of the human environment. John Willy and Sons. New York, USA.
- Tappin, A. D.; Combera, S. and Worsfolda, P. J. (2016). Orthophosphate-P in the nutrient impacted River Taw and its catchment (SW England) between 1990 and 2013. Environ. Sci.: Processes Impacts, 2016, 18, 690-705. http://pubs.rsc.org/en/content/articlelanding/2016/em/c6em00213g#!divAbstract. Accessed November, 2016.
- Tornero, V. and Hanke, G. (2016). Chemical contaminants entering the marine environment from sea-based sources: A review with a focus on European seas. Marine Pollution Bulletin. Vol. 112, Issues 1–2, 15: 2016, pp 17–38.
- UN, (2016a) Sustainable development goals: Goal 6: Ensure access to water and sanitation for all. United Nations (UN). http://www.un.org/sustainabledevelopment/water-and-sanitation/. Accessed December, 2016.
- UN, (2016b). Rate of Environmental Damage Increasing Across the Planet but There Is Still Time to Reverse Worst Impacts if Governments Act Now, UNEP Assessment Says. United Nations Sustainable Development Goals. http://www.un.org/sustainabledevelopment/blog/2016/05/rate-of-environmental-damage-increasing-across-planet-but-still-time-to-reverse-worst-impacts/. Accessed Decamber, 2016. WHO, (2008). Guidelines for Drinking - water Quality, Third edition incorporating the first and second addenda Volume Recommendations, Geneva. World Health Organization (WHO). http://www.who.int/water_sanitation_health/dwq/fulltext.pdf Accessed October, 2016.
- WHO, (2010). Hardness in drinking water. Background document for development of WHO guidelines for drinking water quality; 2010. World Health Organization (WHO).www.who.int/water_health/dwg/chemicals/hardness.pdf. Accessed November, 2016.
- WHO, (2014). Water and Health Information brief. http://www.un.org/waterforlifedecade/pdf/04_2014_water_and_health_info_brief_eng.pdf. Accessed December, 2016.
- WHO, (2015). Lack of sanitation for 2.4 billion people is undermining health improvements. World Health Organization (WHO). http://www.who.int/mediacentre/news/releases/2015/jmp-report/en/. Accessed December, 2016.
- World Water Council, (Undated). Water Supply and Sanitation. http://www.worldwatercouncil.org/library/archives/water-supply-sanitation/ Accessed November, 2016.
- Woodford, C. (2015) Water pollution, an introduction. http://www.explainthatstuff.com/waterpollution.html Accessed October, 2016.
- World Water Council, (Undated). Water Supply and Sanitation. http://www.worldwatercouncil.org/library/archives/water-supply-sanitation/. Accessed October, 2016.
- Water Research Centre, (2014). Phosphates in the Environment. http://water-research.net/index.php/phosphates. Accessed November, 2016.


