Journal of Agricultural Science and Engineering, Vol. 2, No. 5, October 2016 Publish Date: Nov. 2, 2016 Pages: 40-45
An Assessment of the Mhlambanyoni Spring Water Quality at Sigombeni, Swaziland
Bruce Roy Thulane Vilane*, James Dlamini
Department of Agricultural and Biosystems Engineering, Faculty of Agriculture, University of Swaziland, Luyengo Campus, Swaziland
Abstract
Springs are favoured water sources as they often produce high quality water, are inexpensive to protect and do not require a pump to bring the water to the surface. However, spring water may be rapidly contaminated when it emerges. An experiment was designed to assess the water quality of the Mhlambanyoni spring at Sigombeni. It had one treatment; the Mhlambanyoni spring water with three replications. The SWSC treated tap water was used as a control. The WHO water quality guideline values were used for comparisons. The grab sampling technique was used to collect nine water samples during the wet season in January 2016 and nine samples during the dry season in November 2015. In each period, three samples were used for physical analysis (pH and turbidity), another three for microbiological analysis (Total Coliforms and E. coli) and the other three for chemical analysis (nitrates and hardness). The physical analysis results reflected that the Mhlambanyoni spring water had the pH for the wet season; dry season and the SWSC treated tap water (control) were 7.31, 7.20 and 6.8, respectively. The seasonal turbidity of 0.87 NTU in the dry season and 0.67 NTU in the wet season was significantly different. The microbiological analysis results reflected that the E. coli for the Mhlambanyoni spring water for the dry and wet season had means of 240.3 counts/100 ml and 844 counts/100 ml, respectively. On the other hand the Total Coliforms were 2402 per 100 ml, 5475 per 100 ml and no coliforms for the dry season, wet season and SWSC tap water, respectively. The dry and wet seasons were significantly different (P < 0.05). The chemical water quality (nitrates) for the Mhlambanyoni spring water had mean values of 0.43 mg/L and 0.87 mg/L for the dry and wet seasons, respectively. The dry and wet seasons were significantly different (P < 0.05). The results reflected that the spring water was soft as evident from the hardness which had mean values of 43.5 mg/L in the dry season and 567.6 mg/L in the wet season. The E. coli values were above the WHO water quality guideline value of 0 counts/ 100 ml, while the mean nitrate values were within the WHO water quality guideline value of 50 mg/ L. It was concluded that the domestic water from the Mhlambanyoni spring was not suitable for human consumption due to the microbiological quality (Total Coliforms and E. coli) that was above the WHO water quality guidelines. It was recommended that the water from the Mhlambanyoni spring should be boiled first before it is used for consumption due to the contamination.
Keywords
Assessment, Spring, Water Quality, Mhlambanyoni, Sigombeni, Swaziland
Received: August 18, 2016
Accepted: September 13, 2016
Published online: November 2, 2016
@ 2016 The Authors. Published by American Institute of Science. This Open Access article is under the CC BY license. http://creativecommons.org/licenses/by/4.0/
Contents
1.Introduction
Water is critical to life, but it is also a limited resource and several interrelated factors are decreasing its availability (WHO, Undated a; Croket, 2015). These factors include climate changes, increasing demand, lowered water tables and environmental degradation. The major sources of this life critical resource are surface water and groundwater such as springs.
A spring is a water resource formed when the side of a hill, a valley bottom or other excavation intersects a flowing body of groundwater at or below the local water table, below which the subsurface material is saturated with water (Apec Water, 2016). Spring water is the common source of public water supply in most rural communities of developing countries (Simiyu et al, 2009). In the very beginning of human civilization, people have settled close to water sources (Van Wijk-Sibesma, Undated; Hassan, Undated). This does not imply however, that the available sources of water are convenient and of sufficient capacity, nor that the water is safe and wholesome (Hofkes, 1981). The qualities of these water sources vary widely, depending on location and environmental factors. Among the factors determining the qualities of natural waters, ground waters and springs in particular, are the chemical composition of the underlying rocks, soil formations and length of time that the water body has been trapped underground (DWAF, 1997).
The major aspects of water quality are, in decreasing order of importance to health: microbiological, chemical, and physical. However, this order is quite different from the public perception, in which the appearance of the water is more important than the microbiological protection. Citizens invariably demand that their water be "pure" although they have no technically meaningful concept of what "pure" actually means (Goosen and Shayya, 2000).
The first and perhaps the most dramatic potential of the possession of clean; accessible water is to improve the levels of health for the whole community. It is easier to understand the basis of this potential for health improvement by looking at the threats to health when water quality is bad. In almost all small community water supply systems, faecal bacteria are likely to be found. It should be pointless to condemn all supplies that contain some faecal contamination, especially when the alternative source of water is much more polluted. Rather testing of the bacteriological quality of the water should examine the level of faecal pollution, and the amount of contamination of any alternative sources (Geldreich, et al., 2011). According to UNICEF and WHO (2012), 88% of the urban population has access to improved water sources compared to 60% of the population in rural areas of Swaziland such as Sigombeni. The improved water sources are protected wells, springs and boreholes. About 35% of the total population in Swaziland relies on unsafe drinking water sources, mainly from rivers, streams, unprotected wells and springs (Manyatsi and Mwendera, 2007).
Springs are favoured water sources as they often produce high quality water, are inexpensive to protect and do not require a pump to bring the water to the surface. After being filtered, groundwater is generally free from microbes and safe to drink. However, spring water may be rapidly contaminated when it emerges (WHO, Undated b). Water quality testing should thus be carried out twice a year, once in the wet season and once in the dry season. Despite this, the community at Sigombeni utilizes water from unprotected wells, springs and streams without testing due to water scarcity. This could expose the water users in the community to water borne diseases such as diarrhea and bilharzia, hence this study.
Objectives
The objectives comprised the following.
i. To determine the physical (pH and Turbidity) quality of the Mhlambanyoni spring water at Sigombeni.
ii. To determine the microobiological quality (Total Coliforms and E. coli) of the Mhlambanyoni spring water at Sigombeni.
iii. To assess the chemical quality (nitrates and hardness) of the Mhlambanyoni spring water at Sigombeni.
2. Methodology
2.1. Study Area
The study area (Sigombeni) is located in the Middleveld of Swaziland, in the Manzini administrative region (26.5082° S, 31.3713° E). The community has about 7,550 people and 830 homesteads (Swaziland Population census, 2007). The area in general is considered semi-arid with sharp seasonal variations in both temperature and precipitation. It receives an annual rainfall of between 800 mm and 1300 mm. The major water sources are springs and boreholes and a great proportion of the population obtains domestic water from springs.
2.2. Research Design
The research was an experiment. Water samples were collected from the Mhlambanyoni spring and tested at the Swaziland Water Service Cooperation (SWSC) laboratory. The SWSC treated tap water was used as a control. There was one treatment; the Mhlambanyoni spring water, with three replications.
2.3. Sampling Procedure
Sampling was done twice, during the dry season or period, when the area had not received rainfall for a couple of months and during the wet season or period when the area had received rainfall large enough to cause runoff. Polyethylene bottles (500 ml) that were rinsed with distilled water were used for sampling. A total of eighteen samples were collected using the grab sampling technique. In each season or period nine samples were used for physical analysis (pH and turbidity), microbiological analysis (Total Coliforms and E. coli) and chemical analysis (nitrates). Out of the nine samples three samples were for physical analysis (pH and turbidity), three for microbiological analysis (Total Coliforms and E. coli) and the other three samples for chemical analysis i.e. nitrates and hardness.
2.4. Data Collection and Analysis
To avoid decomposition, the water samples were transported to the SWSC laboratory in a cooler box with ice cubes. The samples were tested for physical, chemical, and microbiological quality. The data were analyzed using Microsoft excel computer software, utilizing standard error bars, which were compared against the treated tap water and SWSC drinking water quality guidelines.
2.4.1. Physical Quality Analysis Methods
The physical quality analysis involved performing tests for; pH and turbidity as outlined next.
a). pH
The table pH meter was used to measure the pH level of the Mhlambanyoni spring water. The electrode was immersed in the sample. Readings were taken after 20-30 seconds after the water readings have stabilized. After each test, the electrode was rinsed with distilled water and wiped dry.
b). Turbidity
Turbidity was determined using the Absorptometric Method, adopted from FWPCA methods for chemical analysis of water and wastes, 275 (1969). The spectrophotometer wavelength was rotated until the small display showed 450 nm and 25 ml of the sample when placed into the cell holder (Hatch company, 1999). The physical data were analyzed using Microsoft excel computer software, utilizing standard error bars, which were compared against treated tap water and SWSC drinking water quality guidelines.
2.4.2. Microbiological Quality Analysis Methods
The microbiological quality analysis involved performing tests for Total Coliforms and E. coli in the water samples collected from the spring.
a). Total Coliforms
The coliform group is made up of bacteria with defined biochemical and growth characteristics that are used to identify bacteria that are more or less related to faecal contaminants. The total coliforms represent the whole group and are bacteria that multiply at 37°C.
Total coliforms were determined using reagents, dionized distilled water with the growth medium of 51 g of M-endo ager LES, 25 ml ethanol Abs. and 100 ml of water. The media was boiled. During boiling, the media was stirred to avoid the burning of the undissolved media until it was completely dissolved. The media was then allowed to cool to 45-50°C and dispensed ± 15 ml into each of the 65 mm plastic disposable petri dish. The media was then given 10 minutes to solidify. The freshly prepared plates were stored in an inverted position at 4°C in a dark area. Upon testing using the membrane filtration procedure discussed above, where 100 ml of the sample was used, all colonies that had a pink to dark-red colour with a metallic surface were counted and the results expressed as total coliforms per 100 ml.
b). Faecal coliforms
The term ‘faecal coliforms’, although frequently employed, is not correct: the correct terminology for these organisms is ‘thermotolerant coliforms’. Thermotolerant coliforms are defined as the group of total coliforms that are able to ferment lactose at 44 - 45°C. They comprise the genus Escherichia and, to a lesser extent, species of Klebsiella,, Enterobacter, and Citrobacter. Out of these organisms, only E. coli is considered to be specifically of faecal origin, being always present in the faeces of humans, other mammals, and birds in large numbers and rarely, if ever, found in water or soil in temperate climates that has not been subjected to faecal pollution.
The analysis of faecal coliform was performed using deionized distilled water with the growth medium being 50 g m-FC broth and 100 ml water. The broth was boiled. During the boiling of the broth, constant stirring was done to avoid burning of the undissolved media. The broth was poured into a 47 mm filter culture plates. Upon testing using the membrane filtration procedure, all green colonies were counted and the results presented as faecal coliforms per 100 ml.
2.4.3. Chemical Quality Analysis Methods
The chemical quality analysis involved tests for nitrates and hardness in the spring water samples collected.
a). Nitrates
The standard diazotization method using powder pillows was conducted to analyse the amount of nitrate in the water sample.
b). Hardness
Hardness in water is caused by calcium and magnesium compounds, and occurs naturally. Excessive hard water cause excessive soap consumption, whilst soft water tends to be corrosive. Higher levels may cause incrustation of utensils and pipe works. Concentrations greater than 500 mg/L are considered undesirable for domestic use. The Titriemetric method was used to determine the amount of hardness.
3. Results and Discussion
3.1. Physical Quality Results
a). pH
The results reflected that the pH for the wet season was 7.31, while the dry season had a pH of 7.20 and the SWSC treated tap water, which was the control had a pH of 6.8 (Figure 1). The pH of the Mhlambanyoni spring water was significantly different during the season (dry and wet) as well as with the control.
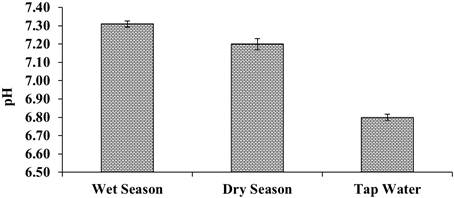
Figure 1. Mhlambanyoni spring water pH.
b). Turbidity
The Mhlambanyoni spring water turbidity was 0.87 NTU and 0.67 NTU during the dry and wet seasons, respectively (Figure 2). The Dry and wet season spring water turbidity was significantly different, but the turbidity for each season was not significantly different to the treated SWSC tap water turbidity.
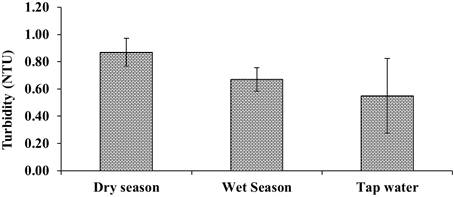
Figure 2. Mhlambanyoni spring water turbidity.
The Mhlambanyoni spring water quality results reflected acceptable turbidity levels of less than one NTU (< 1 NTU) in line with the SWSC drinking water quality guidelines.
3.2. Microbiological Quality Results
a). Total Coliforms
The results indicated that there were total coliform detected in the Mhlambanyoni spring water as reflected in Figure 3. The total coliforms were 2420 per 100 ml, 5475 per 100 ml and no coliforms for the dry season, wet season and the SWSC tap water, respectively.
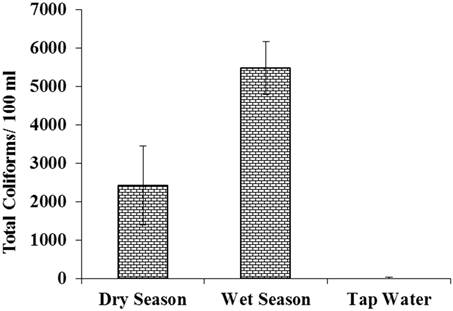
Figure 3. Mhlambanyoni spring water Total coliforms.
b). Faecal coliforms
The microbiological quality results indicated that there were E coli in all the Mhlambanyoni spring water samples collected (Figure 4). The E. coli concentrations for the wet season in the samples ranged from 761 counts per 100 ml to 986 counts per 00 ml, while those for the dry season ranged from 211 counts per 100 ml to 291 counts/100 ml.
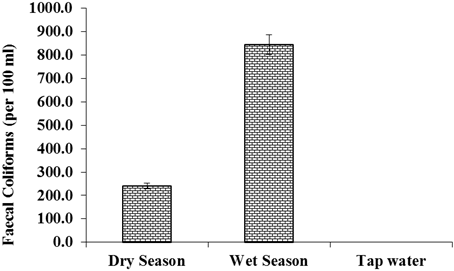
Figure 4. Mhlambanyoni spring water faecal coliforms.
The results indicated that the difference in the means of E. coli for the wet season and the dry season was significantly different. The E. coli concentrations were above the World Health Organization guidelines value of 0 counts/100 ml, which states that no E. coli should be detected in drinking water. As expected, there was no E. coli found in the SWSC treated tap water that was used as a control. The wet season had high E coli levels than the wet season, which could be attributed to the accumulation of faecal matter in the area around the spring, which could then be driven by runoff to the spring during the wet season.
3.3. Chemical Quality Results
a. Nitrates
The results indicated that nitrates were detected in all the Mhlambanyoni spring water samples collected (Figure 5). The spring water nitrates ranged from 0.7 to 1.1 mg/L in the wet season and from 0.3 mg/L to 0.6 mg/L in the dry season.. As expected the SWSC treated tap water (control) had no nitrates. The nitrates were below the World Health Organization guideline value of 50 mg/L. This may be attributed to the absence of cultivated fields near the spring as large amounts of nitrates are a product of nitrogen from fertilizers spread on fields.
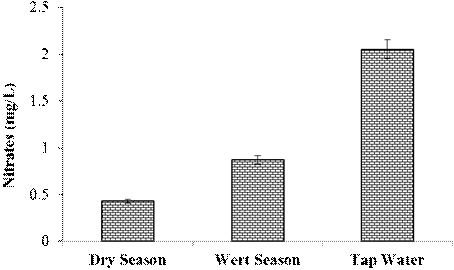
Figure 5. Mhlambanyoni spring water nitrates.
The mean nitrates in the spring water samples collected during the wet season was 0.87 mg/L and it was 0.43 mg/L during the dry season. The results indicated that the difference in the mean nitrates level of the spring water during the wet and the dry season was significantly different (P < 0.05). The nitrates concentration during the wet season was higher (0.87 mg/L) than during the dry season (0.43 mg/L). This difference in the means may be attributed to runoff driven nitrates from the surrounding areas, which accumulated during the dry period and deposited in the spring during the wet season.
b. Hardness
Hardness is the amount of calcium carbonate equivalent per liter (WHO, 2010). It measures the capacity at which water will react with soap. Hard water will require more soap to reduce lather. However, water conataining calcium carbonate at concentration of < 60 mg/L is soft. The results in Figure 6 indicated that the Mhlambanyoni spring water was soft since it ranged from a mean of 43.5 mg/L in the dry season to 57.6 mg/L in the wet season. This could be attributed to the solvent action of rainwater coming in contact with soil and rocks capable of dissolving calcium and magnesium that promote water hardness These findings are in line with the work of Vilane and Dlamini (2016).
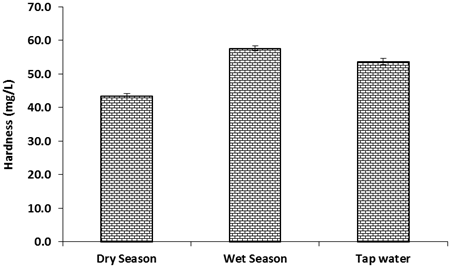
Figure 6. Mhlambanyoni spring water hardness.
4. Conclusions
The physical quality of the Mhlambanyoni spring water at Sigombeni had a pH of 7.31 during the wet season, while it was 7.20 during the dry season and the SWSC treated tap water, which was the control, had a pH of 6.8. The Mhlambanyoni spring water turbidity was 0.87 NTU and 0.67 NTU during the dry and wet seasons, respectively.
The bacteriological water quality assessment of the Mhlambanyoni spring water at Sigombeni reflected the presence of E. coli and Total Coliforms. The spring water samples in the wet season or period had a mean of 844 counts/100 ml and 240.3 counts/100 ml during the dry season or period. The Total Coliforms were 24020 per 100 ml in the dry season and 5475 per 100 ml in the wet season. Both the Total Coliforms and the E. coli were above the World Health Organization guideline value of 0 counts per 100 ml., hence the Mhlambanyoni spring water was not suitable for human consumption.
The chemical quality (nitrates and hardness) analysis of the Mhlambanyoni spring water indicated the presence of nitrates. Even though the nitrates were detected in the spring water, their concentrations were within the World Health Organization guideline value of 50 mg/L. The mean nitrates in the spring water were 0.87 mg/L and 0.43 mg/L during the wet and dry seasons, respectively. The Mhlambanyoni spring water was soft as evident by the mean hardness which was 249.3 mg/L in the dry season and 844.0 mg/L in the wet season. In terms of nitrates, the Mhlambanyoni spring water was suitable for human consumption because they (nitrates) were within the World Health Organization guideline value of 50 mg/L. However, continuous monitoring should be conducted in each season.
References
- Apec Water, (2016). What is spring water and how is it so safe? http://www.freedrinkingwater.com/water_quality/quality1/1-define-spring-water-why-safe.htm . Accessed June, 2016.
- Croket, C. (2015). Quest to trace origin of Earth’s water is a complete mess, Science news. London. United Kingdom.
- DWAF, (1997). White Paper on a National Water Policy for South Africa, Department of affairs and forestry, Pretoria. South Africa.
- Geldreich, E.; Fox, J.; Goorich, E.; Clark, R., and Swerdlow, D. (2011). Searching for a water supply connection in the Cabool, Missouri Disease Outbreak of Escherichia coli. Water Research Journal. 43, 160-166.
- Goosen, M. F. A., and Shayya, W. H. (2000).Water Management, Purification and Conservation in Arid Climates. Lancaster, Pennsylvania, U.S.A.
- Hatch company, (1999) Hatch method 8195. Determination of turbidity by Nephelometry. Revision 2.0. Hach Company 5600. Colorado, USA. www.hach.com/asset-get.download-en.jsa?code=97811. Accessed June, 2016.
- Hassan, F. A. (Undated). Water management and early civilizations: from cooperation to conflict. Institute of Archaeology UCL, UNESCO. http://webworld.unesco.org/water/wwap/pccp/cd/pdf/history_future_shared_water_resources/water_management_early.pdf. Accessed June, 2016.
- Manyatsi, A. M., and Mwendera, E. J. (2007). The contribution of informal water development in improving livelihood in Swaziland: A case study of Mdonjane community. Phys. Chem. Earth. 32, 1148-1156.
- Simiyu, G.; Ngetich, J. and Esipila, T. A. (2009). Assessment of spring water quality and quantity, and health implications in Tongaren division, Nzoia River catchment, Kenya. African Journal of Ecology 47 (s1):99 – 104.
- Swaziland Population Census, (2007). The Government of Swaziland Central Statistics. Mbabane, Kingdom of Swaziland.
- UNICEF and WHO, (2012). Joint Monitoring Programme for Water Supply and Sanitation. Estimates of the use of Improved Drinking Water Sources: Swaziland. WHO Press, Geneva. Switzerland.
- Van Wijk-Sibesma, (Undated). Small Community Water Supplies: technology, people and partnerships http://www.samsamwater.com/library/TP40_1_Introduction.pdf. Accessed June, 2016.
- Vilane, B. R. T. and Dlamini, T. L. (2016). An assessment of groundwater pollution from on-site sanitation in Malkerns, Swaziland. Journal of Agricultural Science and Engineering. Vol 2 (2) 11-17.
- WHO, (Undated a) WHOIntwater sanitation health hygiene settings hvchap3 .http://www.who.int/water_sanitation_health/hygiene/settings/hvchap3.pdf. Accessed June, 2016.
- WHO, (Undated b). Water sanitation health. Fact sheets on environmental sanitation http://www.who.int/water_sanitation_health/hygiene/emergencies/fs2_4.pdf?ua=1. Accessed June, 2016.
- WHO, (2010). Hardness in drinking water. Background document for development of WHO guidelis for drinking water quality; 2010. www.who.int/water_health/dwg/chemicals/hardness.pdf. Accessed September, 2016.


