Journal of Agricultural Science and Engineering, Vol. 1, No. 3, August 2015 Publish Date: Jul. 29, 2015 Pages: 153-162
The Influence of Personal Characteristics, Economic and Social Factors in Adoption of Improved Potato by Small Farmers to Sustain Their Livelihoods in Central Darfur
Heitham Elhaj Mohammed Musa*, Mohmed Badawi, Haj Hamed Abdelaziz, Abdel Mahmoud H. Elshaikh
Department of Agricultural Extension and Rural Development, Faculty of Agriculture, Sudan University of Science and Technology, Khartoum, Sudan
Abstract
This study was conducted as a contribution towards searching a performance of different personal characteristics, social and economic factors that increase small farms productivities using potato crops as sample in order to sustain the livelihoods and alleviating the poverty of the poor farmers who affected by Darfur conflict. This study is also an attempt to show the elements affected the adoption of improved potato crops and reaching recommendations that can be used for developing strategies for effective agricultural extension work and alleviation of poverty among the potato’s small farmers around central Darfur. The study revealed that there is positive relationship between personal characteristic (age, sex, education level, income and family size) and adoption of improved potato by small farmers in order to sustain their livelihoods and alleviate the poverty. The gender was found to have a significant association with adoption of recommended type of soil, sowing date and number of potato tuber per hole; however the gender had no relation with adoption of type of recommended irrigation, agriculture method, spacing between holes, and using of fertilizers. The age was found to have association with adoption of the recommended sowing date and type of irrigation but, there was no association between age and recommended cultivation methods, number of potato tuber, recommended fertilizers, spacing between holes and type of soil. The size of family was found to have a significant relation with adoption of recommended number of potato tuber per hole and had no association with recommended cultivation methods, type of irrigation, recommended fertilizers, spacing between holes and type of soil. The respondent’s social status was not found to have a significant relation with adoption of recommended type of irrigation, recommended fertilizers, number of potato tuber per hole, spacing between holes and type of soil. The family residence status was found to be having a significant association with adoption of recommended spacing between holes, recommended fertilizers and number of potato tubers per hole while there was no significant relation with adoption of recommended agriculture method, sowing date, type of recommended soil and type of irrigation.
Keywords
Personal Characteristics, Economic and Social Factors, Adoption of Improved Potato, Small Farmers, Sustainable Livelihoods
Received: June 9, 2015
Accepted: July 11, 2015
Published online: July 28, 2015
@ 2015 The Authors. Published by American Institute of Science. This Open Access article is under the CC BY-NC license. http://creativecommons.org/licenses/by-nc/4.0/
Contents
1. Introduction 2. Materials and Methods 2.1. Research Methodology 2.2. The Research Population 2.3. Respondents Sample 2.4. Data Collection 2.5. Data Analysis 2.6. The Area of Study 3. Results and Discussion 3.1. Frequency Distribution of Respondents 3.2. Chi-Square Test Results 4. Conclusion Appendix
1. Introduction
The potato is the world’s most important root and tuber crop worldwide. It is grown in more than125 countries and consumed almost daily by more than a billion people. (NeBambi Lutaladio, Oscar Ortiz, Anton, Haverkort and Daniel Caldiz 2009).
Potatoes are native to the Andean region of South America. European explorers introduced the potato to Europe in 1536 and Potatoes are the number one non‐grain food crop in the world. Potato cultivation is expanding strongly in the developing world, where the potato’s ease of cultivation and nutritive content has made it a valuable food security and cash crop for millions of farmers. Developing countries are now the world’s biggest producers – and importers – of potatoes and potato products. Ne Bambi, Oscar, Danniel and Anton 2009). Once harvested, potatoes can be used for a variety of purposes: as a fresh vegetable for cooking at home, as raw material for processing into food products, food ingredients, starch and alcohol, as feed for animals, and as seed tubers for growing the next season’s crop.
Potatoes are a cool season crop; ideal temperatures for crop growth are 65 to 80 during the day and 55 to 65 at night. The soil should be cultivated 6 to 8 inches deep in the spring, and large soil clods should be broken up or removed before planting. Plant potatoes when soil temperatures are above 45 F. Cold, wet soil at planting time increases the risk of seed piece decay, and planting into cool, dry soils can cause delayed sprouting and emergence of the potatoes. (Kelly, Donna, David and C. Robin).
The potato is essentially a "cool weather crop", with temperature being the main limiting factor. In tropical areas, potato should be grown where the climate is tempered by altitude (1 500 – 4 200 m) or at lower altitudes provided the crop is grown during the cool season. (NeBambi, Oscar, Anton and Daniel 2009).
The ideal condition for tuberization is a night temperature of around 16°C, while optimum yields are obtained where mean daily temperatures are in the 18-20°C range. Loose, moist and well-drained slightly acid soil (with pH of 5.0-5.5) or volcanic upland soils are preferred. The water supply for the potato crop should be regular, especially from the stage of tuber initiation until the end of tuber enlargement. (NeBambi, Oscar , Anton and Daniel 2009)
Plant tuber seed pieces 3 to 4 inches deep. Leaving 30 to 36 inches between rows and spacing seed pieces 9 to 12 inches apart in the row will generally produce an acceptable yield of medium‐sized tubers. Five pounds of seed potatoes should plant 40 feet of row with 12 inches between seed pieces. You can expect to harvest 3 to 5 pounds of potatoes per potato plant. Larger tubers are produced at wider plant spacing, though some varieties, for example, Yukon Gold, develop growth defects such as hollow heart at a wider spacing. (Kelly, Donna, David and C. Robin).
A successful potato crop depends on judicious cultural practices. These include good knowledge of variety purity and characteristics such as dormancy duration, the physiological condition of seed potato tubers (well sprouted and 30-80 g in weight, depending on variety) and resistance to the main transmissible potato diseases and nematodes. (NeBambi, Oscar, Anton and Daniel 2009)
Potatoes are best grown in rotation. In the Andes, it is usually the first crop in the rotation. In other regions, it can be planted after cereals and before legumes, but not with crops (e.g. tomato and other solanaceae) that are susceptible to the same pathogens as the potato. Sometimes natural fallow is necessary to prevent soil impoverishment and the build-up of potato specific diseases and insect pests. Soil preparation for the potato crop should be adequate with minimum soil disturbance. Naturally loose soils, and loamy and sandy loam soils that are rich in organic matter with good drainage and aeration, are the most suitable. Planting depth, density and spacing depend on the variety chosen and tuber size, and should allow for shallow inter-row ridging, when required. Usually, about two tons of seed tubers are planted per hectare. NeBambi, Oscar, Anton and Daniel 2009)
To give the crop a competitive advantage, weeding should be performed after full crop emergence (about 4 weeks after planting) and after the plants have reached a height of about 20 cm. Shallow ridging is done subsequently to prevent the stolons becoming aerials, and to protect tubers against insect pests, disease infection and greening. Crop rotation and careful chemical control with herbicides, applied at minimum lethal doses, may be part of an integrated weed management system, although in most developing countries weed management is usually carried out manually.(Kelly, Donna, David and C. Robin)
During violent conflicts in Darfur the assets of Central Darfur people get loss or destroyed through heavy fighting and looting. These include houses, land, labour, utensils, cattle, livestock and other productive assets. The very poor are likely to be the worst affected. A Twelve per cent of all households lost their house during the 1994 Rwandan genocide, while cattle stock on average decreased by 50per cent. The homes and livelihoods of around seven per cent of households were damaged during the civil war in Tajikistan between 1992 and 1998. The Burundi conflict in the 1990s was associated with severe asset depletion. (Bundervoet & Verwimp 2005).
These effects are as important in understanding processes of armed conflict as the more negative effects of fighting as both will have significant bearing on the sustainability of peace during the post-conflict period. (Patricia Justino 2011).
In conflict zones where displacement and insecurity undermine people’s ability to pursue livelihoods, links with the diaspora, particularly the remittances they send, are an important source of support. But displacement and insecurity obstruct existing remittance channels, and it is thought that remittance receipts tend to decline after displacement even as they assume relatively greater importance in supporting livelihoods. Primary research on the change in remittance patterns before and after displacement is difficult to conduct, and there are very few studies that have explored this important livelihood dynamic. (Young, Kren, Osman 2007)
Violent conflicts kill and injure civilians and combatants alike and cause severe psychological damage to those involved in fights, to those living in war-torn communities and to displaced populations. The levels of mortality and morbidity associated with armed conflict are explained not only as outcomes of fighting but are also for the most part the result of spreading disease and malnutrition (Guha-Sapir and Degomme 2006).
In Darfur most of Internal Displaced peoples (IDPs) continue to depend on food assistance, which despite 50% ration cuts in May 2008, continue to comprise a significant share of their food sources. Many of the new strategies involve protection threats, or, like daily casual labour, are short-term, or limited, as in the case of food aid where rations can be cut by half over-night (Young, Abdel Muntum 2007).
The IDPs who leave the camps to collect firewood or to try to cultivate potentially risk intimidation, harassment, looting or violence. The collection of firewood by IDP women is widely associated with gender based violence, specifically rape. However, not all our IDP respondents faced this security risk. The livelihood links between perpetrators of GBV (Gender Base Violence) and their victims are often overlooked by outsiders. Some of the new strategies adopted by IDPs, such as the sale of firewood, water-selling and brick-making, are unsustainable either because they over exploit limited natural resources in a fragile ecosystem, or because they are linked to markets distorted by the conflict, the presence of the international community and large scale of displacement. (Helen Young, Lisa Goldman 2015).
In this fragile economy, fractured by its links with coercion and violence and where the natural environment is over-exploited with few if any controls, livelihoods are extremely precarious and very few IDP livelihood strategies could be considered secure or sustainable in the longer-term. (Macro Kerste, N. Rosenboom 2008)
2. Materials and Methods
2.1. Research Methodology
Social and field survey were conducted in this research
2.2. The Research Population
Before Darfur conflict in 2003 Central Darfur and the Jebel Marra area located more than 400 villages, however during the conflict most of these villages abandoned. Ten of the remaining villages their farmers were familiar with growing potato. The farmers of these ten villages used as research population. The villages of the research selected according to the stability of security situation and availability of the target group in the areas. The six villages out of ten were chosen to be the research sample. The selected villages were specifically Nertiti, Thur, Gurnee, Zalingei, Dankog and Delaig.
A random sample of 180 persons was chosen from the research population. The head of Shaikhs of every area calculated the number of small potato’s farmers and 30 persons were chosen randomly from each village because all villages were synonymously similar in density and distribution of people.
Primary data was collected using questionnaire, personal interviews and observation. While secondary data was collected through reference books, reports, previews related research and the internet. The data collected by four people having experiences on data collection and also trained to collect such information.
Simple descriptive statistic frequency distribution and Chi-Square test were used to have inferences about some variables of the study.
2.6. The Area of Study
Darfur region extends over an area as large as Spain. In 1995, Darfur was divided into three states: west, north and south Darfur. West Darfur state covers more than 75,000 square kilometers in the westernmost region of Sudan. It features a marked agro-climatic gradient, with west Darfur’s northern zone consisting largely of semi-desert hills and rocky land-escapes. The state central zone, located between latitudes 12-14 N, contains a dry savanna as well as the Jebel Mara mountains range and plateau, with includes fertile and forested land. (Satti and A. Peter Castro 2012). Central Darfur, with the capital Zalingei located in central zone, west of the Jebel Mara mountain range and plateau, a volcanic massif whose highest peaks rise to 3,000 meters above sea level. The Jebel Mara serves as its chief supplier of water, including seasonal streams which flow through the area’s valleys, farm-land and pastures during rainy season. Almost two-third of Zalingei’s annual average total of approximately 570 mm during July and August (Satti, Castro 2013). However, considerable variation occurs from year to year.
The study conducted in central Darfur in six areas namely, Nertiti, Thur, Gurney, Zalingei, Dankog and Delaig. The area was selected according to the place of planting potato. The total number of population samples studies was "180" individuals selected from targeted villages randomly and some of the target group were IDPs and others were residents. The target group also involve men and women at all areas and its worth nothing that women in all areas were productively more active.
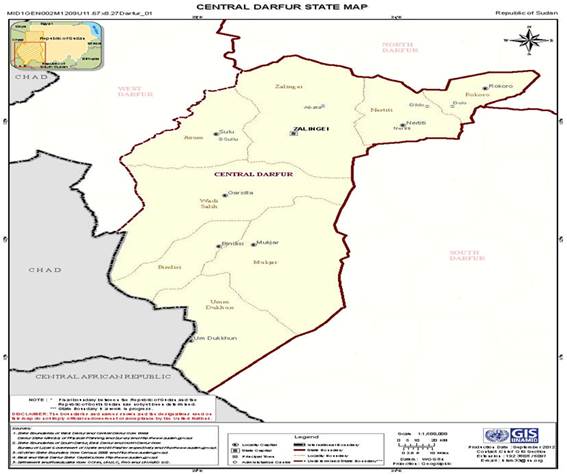
Figure (1). Central Darfur Administrative Map - Source GIS – United Nation Mission In Darfur –Sudan.
3. Results and Discussion
3.1. Frequency Distribution of Respondents
Table (3.1.1). Frequency distribution of respondents according to the Gender:
| Gender group | Frequency | Percent |
| Male | 156 | 86.7 |
| Femal | 24 | 13.3 |
| Total | 180 | 100.0 |
Source: Filed survey 2013
Table (3.1.1) indicates that 86.7% of potato producers are male and only 13.3% female. Generally potato production was male dominated (86.7%), however more recently the interest of livelihoods program has expanded to be inclusive to men and women with a wider range of agencies paying attention to how livelihoods can be supported through developing small farms to alleviate poverty among rural people.
Table (3.1.2). Frequency distribution of the respondents according to their age.
| Age Group | Frequency | Percent |
| 20 -29 | 36 | 20.0 |
| 30 – 39 | 75 | 41.7 |
| 40 – 49 | 55 | 30.6 |
| 50 – 59 | 11 | 6.1 |
| Over 60 | 3 | 1.6 |
| Total | 180 | 100.0 |
Source: Filed survey 2013
Table (3.1.2) indicates that 41.7% of potato producers were over 30 years of age and 30.6 % were 40 and under 50 years of age. It shows that most of the potato’s producers were youth; therefore, it will be easy to convince them to accept any new technology in order to change the traditional methods of agricultural practices.
Table (3.1.3). Frequency distribution of the respondents according to the social status.
| Social status | Frequency | Percent |
| Single | 28 | 15.5 |
| Married | 150 | 83.3 |
| Divorced | 1 | .6 |
| Abandoned | 1 | .6 |
| Total | 180 | 100.0 |
Source: Filed survey 2013.
Table (3.1.3) shows that 83.3% of the study sample in the areas of study were married, while 15.5 were single. The high percentage of married farmers indicated that the family is stable and it will be easy to convince to adopt the new practices of improved potato in order to have more income.
Table (3.1.4). Frequency distribution of respondents according to level of education.
| Education level | Frequency | Percent |
| Yes | 128 | 71.1 |
| Some how | 36 | 20.0 |
| No | 16 | 8.9 |
| Total | 180 | 100.0 |
Source: Filed survey 2013.
Table (3.1.4) indicates that 71.1% of farmers in area of study were educated and 20 % they can read and write, it also shows that the education level among the sample of the study is high. However the illiterate sample only 8.9%. The high percentage of educated farmers is more likely to adopt improved potato than those who have never been to school. Also the more educated household head is expected to be more efficient to understand and obtain new technologies in short period of time compare to uneducated people.
Table (3.1.5). Frequency distribution of respondents according to family size.
| Family size | Frequency | Percent |
| 2 – 3 | 26 | 14.4 |
| 4 – 6 | 54 | 30.0 |
| 7 – 10 | 100 | 55.6 |
| Total | 180 | 100.0 |
Source: Filed survey 2013.
Table (3.1.5) indicates that 55.6 % of the respondents their family size between 7-8 individuals and the relation between family size and adoption of potato technologies to improve the livelihoods of the target family will be positive putting in mind that the big family size plays role in labour provision. Adoption of new technology required more labour inputs. Moreover, the large families attached greater importance to farm and nonfarm activities to meet the increased needs of their family.
Table (3.1.6). Frequency distribution of respondents according to residence status.
| Residence status | Frequency | Percent |
| IDPs in camps | 31 | 17.2 |
| IDPs outside camps | 25 | 13.9 |
| Residents in towns | 118 | 65.6 |
| Returnees | 5 | 2.8 |
| Nomads | 1 | .6 |
| Total | 180 | 100.0 |
Source: Filed survey 2013.
Table (3.1.6) shows that 65.6% of the respondents are residents in towns and have potential access to the financial support from government institutions such agricultural bank to get potato’s inputs and easily improved their production and earn more income. The percentage of the IDPs is 31.1% indicated that the number is small compared to the residents. Most of them left home of origin and work as labour in farms of resident people. The IDPs are more vulnerable group and the percentage of poverty is high among them, it would be very important to be under focus by development agencies to alleviate their poverty.
Table (3.1.7). Frequency distribution of respondents according to type of housing.
| Type of housing | Frequency | Percent |
| Hut/mud/bricks | 115 | 63.9 |
| Hut/grass/wood/plastic | 32 | 17.8 |
| Hut/ grass/wood | 33 | 18.3 |
| Total | 180 | 100.0 |
Source: Filed survey 2013.
Table (3.1.8) indicates that 63.9% of farmers in study area living in Huts structured and made from mud or bricks covered with grass, it means that they are living as residents in small villages or towns. It also shows that the living condition is very poor compared to modern living condition. However 17.8% living in huts made from grasses or wood and covered with plastic sheet are mainly IDPs and the poorest of poor.
Table (3.1.8). Frequency distribution of respondents according to source on income.
| Income sources | Frequency | Percent |
| Agriculture only | 115 | 63.9 |
| Agriculture and trade | 38 | 21.1 |
| Trade | 15 | 8.3 |
| Agriculture and livestock | 1 | .6 |
| Labour | 3 | 1.7 |
| Other | 8 | 4.4 |
| Total | 180 | 100.0 |
Source: Filed survey 2013.
Table (3.1.8) indicates that 63.9 of respondents their income sources depend on agriculture only while 21.1 got income from practicing agriculture and trade. It is important to understand that farming and herding are practiced throughout Darfur, and rarely undertaken as separate activities. In other words, nearly all farmers rear livestock, while nearly all herders cultivate crops. However according to the data above 6% depend on agriculture and livestock on their income. Most of the farmers do not prefer to have livestock as income resource because of security challenges.
Table (3.1.9). Frequency distribution of respondents according to source of income from other livelihoods activities.
| Livelihoods activities | Frequency | Percent |
| Sale of cereal | 112 | 62.2 |
| Sale of other crops& products | 42 | 23.3 |
| Sale of livestock | 1 | .6 |
| Agriculture wage labour | 9 | 5.0 |
| Non-agriculture work | 3 | 1.7 |
| Sale of handicraft | 3 | 1.7 |
| Sale of firewood | 3 | 1.7 |
| Petty trade | 3 | 1.7 |
| Gift from families and relatives | 4 | 2.2 |
| Total | 180 | 100.0 |
Source: Filed survey 2013
Table (3.1.9) shows that 62.2% sailing cereals mainly sorghum and millet, supplemented by cultivating small groundnuts and maize to increase their income, while 23.3 % selling other crops and agricultural products (such watermelon, vegetable). 5.0% of the respondents working as agriculture labour to get income.
Table (3.1.10). Frequency distribution of respondents according to constraints affecting sources of income.
| Constraint | Frequency /Percentage | Total | |||
| Yes | % | No | % | ||
| Insecurity | 154 | 85.6 | 26 | 14.4 | 100 |
| Lack of manpower | 156 | 86.7 | 24 | 13.3 | 100 |
| Distance to the market | 40 | 22.2 | 140 | 77.8 | 100 |
| Low price of Agriculture production | 97 | 53.9 | 83 | 46.1 | 100 |
| Low price of animal production | 15 | 8.3 | 165 | 91.7 | 100 |
| Limited employment | 34 | 18.9 | 146 | 81.1 | 100 |
| Low agriculture production | 77 | 42.8 | 103 | 57.2 | 100 |
| Low animal production | 14 | 7.8 | 166 | 92.2 | 100 |
| Disability& health problems | 59 | 32.8 | 121` | 67.2 | 100 |
Source: Filed survey 2013
Since Darfur conflict started in 2003 the security issue became as main concerns to the farmers in whole region. In central Darfur where the fighting started 85.6 % of the sample responded that the insecurity is one constraint facing them to cultivate potato crops in their area, however other farmers 14.4% have seen that the insecurity is not main constraint. The insecurity can be described according to the farmers by looting their properties during the cultivation and harvesting season, killing and beating of the farmers by outlaws’ armed people. During the period of the study it was observed that the natural conflict between nomads and farmers over water resources, fodder, migration routes and farms destruction. The protection of civilian mainly farmers need more intervention from government authorities to protect them to continue their livelihoods. The table also shows that 86.7 % of sample responded that lack of manpower is constrain facing them to cultivate potato. The diffusion of appropriate technology such as animal traction by agriculture extension office could be one of the solutions.
3.2. Chi-Square Test Results
Table (3.2.1). Gender and adoption type of recommended soil.
| Value | df | Asymp. Sig. (2-sided) | |
| Pearson Chi-Square | 6.462a | 2 | .040 |
| Likelihood Ratio | 6.566 | 2 | .038 |
| Linear-by-Linear Association | 3.081 | 1 | .079 |
| N of Valid Cases | 180 |
Source: Filed survey 2013
The table (3.2.1) shows that there was significant relation between gender and adoption type of recommended soil to grow improved potato as Chi- Square value= (6.462) at level of significant of (.040) which means that the gender has impact on adoption and practicing the recommended type of soil to grow improved potato.
Table (3.2.2). Gender and adoption of sowing date.
| Value | df | Asymp. Sig. (2-sided) | |
| Pearson Chi-Square | 19.125a | 3 | .000 |
| Likelihood Ratio | 15.310 | 3 | .002 |
| Linear-by-Linear Association | 7.137 | 1 | .008 |
| N of Valid Cases | 180 |
Source: Field survey 2013
The table (3.2.2) shows that there was strong significant relation between Gender and adoption of sowing date on improved potato as Chi- Square value= (19.125) at level of significant of (.000) which means the existence of high relation and impact of gender on adoption of sowing date.
Table (3.2.3). Gender and adoption type of recommended irrigation.
| Value | df | Asymp. Sig. (2-sided) | |
| Pearson Chi-Square | .942a | 2 | .624 |
| Likelihood Ratio | 1.126 | 2 | .570 |
| Linear-by-Linear Association | .299 | 1 | .584 |
| N of Valid Cases | 180 |
Source: Field survey 2013
Table (3.2.3) shows that there was no significant relation between gender and adoption type of recommended irrigation to grow improved potato as Chi- Square value= ( .942) at level of significant of (.624) which means that the gender had no impact on adoption and practicing the recommended type of irrigation to grow improved potato.
Table (3.2.4). Age and adoption of improved potato.
| Value | df | Asymp. Sig. (2-sided) | |
| Pearson Chi-Square | 11.753a | 4 | .019 |
| Likelihood Ratio | 14.045 | 4 | .007 |
| Linear-by-Linear Association | 1.883 | 1 | .170 |
| N of Valid Cases | 180 |
Source: Field survey 2013
The table (3.2.4) show that there was a significant relation between Age and adoption of improved potato as Chi- Square value= (11.753) at level of significant of (.019) which means that the age had impact on adoption of improved potato.
Table (3.2.5). Age and adoption type of recommended soil.
| Chi-Square Tests | |||
| Value | df | Asymp. Sig. (2-sided) | |
| Pearson Chi-Square | 9.486a | 8 | .303 |
| Likelihood Ratio | 10.200 | 8 | .251 |
| Linear-by-Linear Association | 2.348 | 1 | .125 |
| N of Valid Cases | 180 | ||
Source: Field survey 2013
Table (3.2.5) shows that there was no significant relation between Age and adoption of type of recommended soil to grow improved potato as Chi- Square value= (9.486) at level of significant of (.303) which means that the age had no impact on adoption of recommended type of soil.
Table (3.2.6). Age and adoption of sowing date.
| Chi-Square Tests | |||
| Value | df | Asymp. Sig. (2-sided) | |
| Pearson Chi-Square | 31.865a | 12 | .001 |
| Likelihood Ratio | 29.461 | 12 | .003 |
| Linear-by-Linear Association | 1.764 | 1 | .184 |
| N of Valid Cases | 180 | ||
Source: Field survey 2013
Table (3.2.6) shows that there was strong significant relation between the age and adoption of recommended sowing date to grow improved potato at level of significance .000 which means that the age had impact on adoption of the recommended sowing date of improved potato.
Table (3.2.7). Family size and adoption of improved potato seeds.
| Chi-Square Tests | |||
| Value | df | Asymp. Sig. (2-sided) | |
| Pearson Chi-Square | 3.062a | 2 | .216 |
| Likelihood Ratio | 3.313 | 2 | .191 |
| Linear-by-Linear Association | .278 | 1 | .598 |
| N of Valid Cases | 180 | ||
Source: Field survey 2013
Table (3.2.7) shows that there was no significant relation between the family size and adoption of improved potato seeds at level of significance (.216)which means that the family size had no impact on adoption of improved potato.
Table (3.2.8). Income and adoption of recommended type of irrigation.
| Chi-Square Tests | |||
| Value | df | Asymp. Sig. (2-sided) | |
| Pearson Chi-Square | 8.777a | 10 | .553 |
| Likelihood Ratio | 11.513 | 10 | .319 |
| Linear-by-Linear Association | .086 | 1 | .769 |
| N of Valid Cases | 180 | ||
Source: Field survey 2013
Table (3.2.8) shows that there was no significant association between the income and adoption of recommended type of irrigation to grow improved potato at level of significant (.553) which means that the income has no impact on adoption of recommended type of irrigation to grow improved potato.
Table (3.2.9). Income and adoption of recommended type of irrigation.
| Chi-Square Tests | |||
| Value | df | Asymp. Sig. (2-sided) | |
| Pearson Chi-Square | 37.725a | 15 | .001 |
| Likelihood Ratio | 44.678 | 15 | .000 |
| Linear-by-Linear Association | .202 | 1 | .653 |
| N of Valid Cases | 180 | ||
Source: Field survey 2013
Table (3.2.9) shows that there was a significant association between the income and adoption of recommended type of irrigation to grow improved potato at level of significance (.553) which means that the income had no impact on adoption of recommended type of irrigation to grow improved potato.
Table (3.2.10). Income and adoption of recommended spacing between the holes.
| Chi-Square Tests | |||
| Value | df | Asymp. Sig. (2-sided) | |
| Pearson Chi-Square | 37.725a | 15 | .001 |
| Likelihood Ratio | 44.678 | 15 | .000 |
| Linear-by-Linear Association | .202 | 1 | .653 |
| N of Valid Cases | 180 | ||
Source: Field survey 2013
The table (3.2.10) shows that there was a significant association between the income and adoption of recommended spacing between the holes when growing improved potato at level of significance (.001) which means that the income had impact on adoption of recommended spacing between holes.
4. Conclusion
The study revealed that there is positive relationship between personal characteristic (age, sex, education level, income and family size) and adoption of improved potato by small farmers in order to sustain their livelihoods. According to the result, the study showed that there is a positive significant relationship between gender and adoption of recommended soil to grow improved potato. Through the simple analysis by using frequency distribution of respondents according to the age the results showed that (61. %) of potato producer were over 20 and 30 years of age and (30.6 %) over 40. 83.3% of the study sample in the areas of study was married, while 15.5 % were single. Majority of farmers (71.1%) in area of study were educated and 20 % they can read and write, it also shows that the education level among the sample of the study is high. The high percentage of educated farmers is more likely to adopt improved potato than those who have never been to school. The study showed that (55.6 %) of the respondents their family size between 7-8 individuals and the relation between family size and adoption of potato technologies to improve the livelihoods of the target family will be positive putting in mind that the big family size plays role in labour provision. Adoption of new technology required more labour inputs. Moreover, the large families attached greater importance to farm and nonfarm activities to meet the increased needs of their family. 63.9% of respondents their income sources depend on agriculture only while 21.1 got income from practicing agriculture and trade. The study revealed that 85.6 % of the sample responded that the insecurity is main constraint facing them to cultivate potato crops in their area. And during the off season 62.2% of farmers sailing cereals mainly sorghum and millet, supplemented by cultivating small groundnuts and maize to increase their income and to sustain their livelihoods. The study recommended to the ministry of Agriculture at Central Darfur level to improve the agricultural extension program and the program should be directed to bring about change in attitudes and practices among poor farmers to alleviate their poverty.
Appendix
A questionnaire for collecting information required for PhD. In agricultural extension and rural development
Title of the study: Sustaining livelihood to alleviate poverty through planting improved potato in small farms in Central Darfur State- Sudan
1 Name………………………………………………
2 Gender: Male ( ) Female ( )
3 Age: 20- 29 ( ) 30- 39 ( ) 40- 49 ( ) 50- 59 ( ) Above 60 ( )
4 Social status: Single ( ) Married ( ) Separated ( ) Divorced ( ) abandoned( )
5 Career: Farmer ( ) Trader ( ) Labour ( ) Employer ( ) Other ( )
6 Do you read and write? Yes ( ) No ( ) Somehow ( )
7 Family size (individuals): 2-3 ( ) 4-6 ( ), 7- 10 ( ) Above 10 ( )
8 What is the residence status of the household?
IDPs in camps ( ) IDPs outside camps ( ) Resident ( ) Returnees ( ) Nomads ( )
9 What housing structure does the household live in at present?
• Hut (Structure made at least in part with mud/ or bricks) ( )
• Hut (structure made from grasses or wood covered with plastic sheet) ( )
• Hut made from grass and wood only ( )
10 What are your main income sources?
Agriculture only ( )
Trade ( )
Livestock only ( )
Agriculture and livestock ( )
Agriculture and trade ( )
Labour ( )
Others " specify" ( )
11 What is livelihoods activity that you practice as another source of income during the year?
• Sale of cereals, sorghum, millet…… etc ( )
• Sale of other crops and products (vegetables, groundnuts, tobacco, watermelon….. etc) ( )
• Sale of livestock and animal products ( )
• Agricultural wage labour ( )
• Non- agricultural work (casual, skilled…….etc) ( )
• Sales of handicrafts ( )
• Sale of fire wood, charcoal or grass ( )
• Petty trader, including bricks making ( )
• Remittances ( )
• Gifts from families and relatives ( )
• Sale of food aid ( )
12 Do you face constraints currently for your sources of income? Yes ( ) No ( ) Sometimes ( )
13 If yes, tick () for constraints that your are facing currently
1 Insecurity to move to the farm ( )
2 Lack of manpower in the household. ( )
3 Closure of the markets ( )
4 Low prices or demand of agricultural, animal or other produce sold by the household. ( )
5 Limited employment/ labour opportunities/ lack of jobs ( )
6 Low agricultural production ( )
7 Low animal production ( )
8 Disability or health problems ( )
14 Did you cultivate potato crop this year?
Yes ( ) No ( )
15 If yes, what type of soil you grow in?
Heavy clay soil ( ) Light clay soil ( ) Sandy soil ( ) Sand and clay soil ( )
16 How many Fedan did you plant with potato?
Less than one ( ) 1-2 ( ) 3- 4 ( ) Above 5 ( )
17 What kind of land ownership?
Own land ( ) Land rent ( ) partnership ( )
18 When did you grow potato?
October ( ) November ( ) December ( ) January ( ) other "specify" ( )
19 What kind of irrigation sources that you are using for planting?
Rain ( ) Rain supplemented by irrigation from valleys ( ) irrigation from valleys ( )
20 What method you used for cultivating potato?
Ridges ( ) Plots ( ) Others "specify" ( )
21 What is the spacing between holes you used for planting potato?
10-19cm ( ) 20- 29cm ( ) 30- 39cm ( ) 40- 49cm ( ) Above 50 ( )
22 How many tubers you used per hole?
Half tuber ( ) One tuber ( ) Two tuber ( ) More than two ( )
23 Did you use fertilizers for cultivation?
Yes ( ) No ( ) Sometimes ( )
24 When did you add fertilizers in the last season?
Before planting ( ) during planting ( ) After planting ( ) before and during planting ( )
25 Did you use pesticides for potato?
Yes ( ) No ( )
26 Was it easy to get improved potatoes?
Very easy ( ) easy ( ) very difficult ( ) difficult to get ( )
27 If you plant improved potato, what was the difference in productivity between local and improved variety?
Very big ( ) Big ( ) Medium ( ) little Very little ( ) none ( )
28 Was the improved potato expensive?
Very expensive ( ) expensive ( ) reasonable ( )
29 Do you want to grow improved variety of potato in the next year?
I want strongly ( ) I want ( ) I don't want strongly ( ) I don't want ( ) I don’t know ( )
30 What about the availability of labour during cultivation of improved potato in the last season?
Abundant ( ) Very abundant ( ) Sometimes not abundant ( ) Not abundant at all ( )
31 Is the cost of labour for growing potato cheap compared to the other cash crops?
Very cheap ( ) Cheap ( ) Very expensive ( ) Expensive ( )
32 How did you describe the length of growing season of improved potato compared to the local one?
Short time ( ) Medium ( ) Very long time ( ) Long time ( )
33 How did you get the agricultural tools for cultivating improved potato?
| Tool | Available and cheap to buy | Available and expensive to buy | Not available |
| Big hoe | |||
| Small hoe | |||
| Weeder | |||
| Donkey plough | |||
| Tridle pump | |||
| Watering can | |||
| Spray tools | |||
| Fertilizer tools | |||
| Harvest tools |
34 Did you thin potatoes this year?
Yes ( ) No ( )
35 What was the date of thinning that you have done?
1-2weeks after planting ( ) 3-4 weeks ( ) 5- 6 weeks ( )
36 Is the improved potato easy in marketing?
Very easy ( ) Easy ( ) Very difficult ( ) Difficult ( )
37Did you have any training about cultivation of potato?
Yes ( ) No ( )
38 If yes, who trained you?
Jebel Marra Scheme ( )
Ministry of Agriculture ( )
Through agricultural Extension Division ( )
Governmental Organizations ( )
Non Governmental Organizations ( )
Local organizations ( )
39 Which of the following sources, you got agricultural information?
• Extension leaflets ( )
• Posters ( )
• Training courses ( )
• Radio ( )
• TV ( )
• Agricultural Extension agents ( )
• Neighboring famers and relatives ( )
• Field visits ( )
• office visits ( )
• field days ( )
40 Do you communicate the agricultural Extension agents to receive agricultural information?
Yes I do always ( ) Sometimes ( ) rarely ( ) No I don't ( )
41 Are there any constraints facing you when cultivating improved potato?
Yes ( ) No ( ) Sometimes ( )
42 If yes or sometimes tick the below mentioned answers:
• Shortage of local potato ( )
• Shortage of improved potato seeds ( )
• Poor soil fertility ( )
• Pests, weeds and crop diseases ( )
• Water shortage (poor rains, lack of irrigation ( )
• Lack of animal for traction ( )
• Lack of agricultural tools ( )
• Insecurity to go to the field, displacement or
land disputes ( )
• Lack of access or shortage of
land to cultivate ( )
43 What are the kinds of economic activities that you practice after the agricultural season?
• Petty trade ( )
• Sale of fire wood/ charcoal ( )
• Masonry labour ( )
• Sale of grasses/ fodders ( )
• Making bricks ( )
• Sewing works ( )
• Sales of handicrafts ( )
• Wood work ( )
• Remittances ( )
References
- NeBambi Lutaladio, Oscar Ortiz, Anton Haverkort and Daniel Caldiz - Sustainable potato production - FAO 2009.
- (Kelly, Donna , David and C. Robin, A Guide to Growing Potatoes in your home Garden
- Helen Young, Abbul Monim Osman (June 2005) - Darfur- livelihood under siege
- Yasir Satti, Castro 2013 - Climate change paper
- Patricia Justino 2011, Poverty and violent conflict- MICROCON Research working paper
- Bundervoet, Tom & Philip Verwimp, 2005. ‘Civil War and Economic Sanctions: An Analysis of Anthropometric Outcomes in Burundi’, Households in Conflict Network, Working Paper 11(http://www.hicn.org/papers/wp11.pdf).
- Helen Young, Karen, Osman 2007 – Livelihoods , Migration and conflict
- Helen Young, Abdel Montum Osman 2007 – Sharpening the strategic Focus of livelihoods in the Darfur Region
- Guha-Sapir and Degomme November 2006 – Darfur Crisis - Death Estimates Demonstrate Severity of Crisis, but Their Accuracy and Credibility Could Be Enhanced - GAO
- Helen Young, Lisa Goldman 2015 - Livelihoods, Natural Resources, and Post-Conflict Peace building
- Macro Kerste, N.Rosenboom 2008 – Financing Sustainability - UNEP


