Journal of Agricultural Science and Engineering, Vol. 1, No. 3, August 2015 Publish Date: Jul. 15, 2015 Pages: 120-134
The Role of Information Asymmetry in Monitoring Food Security Programme in ‘Bar A’ Sub Location Kisumu County
Samuel Jerry Odindo1, Dan Odhiambo Odindo1, *, Aaron Mwayi2
1Department of Health System Management, Faculty of Community Health and Development, Great Lakes University of Kisumu; Kisumu, Kenya
2Department of Health Promotion, Faculty of Community Health and Development, Great Lakes University of Kisumu; Kisumu, Kenya
Abstract
This was a longitudinal research that monitored the same households for one seasons and later on display the information to the farmers on a noticeboard as a way of sensitizing them on good farm management practices. The use of a noticeboard is a positioning concept from community health strategy that uses chalkboard as community based health information system to monitor health status in the community. Key findings was analyzed and used to determine the role of the information on the notice board in increasing food production and also to determine farm inputs and activities that are associated with production of food crops in ‘Bar A’ sub location, as a way of eradicating poverty and hunger in the sub location. Census was done for the 640 households. Descriptive statistics was used to determine the frequency of households engaged in different variables grouped as: -, total household member, acreage of arable land and acreage ploughed for maize and beans, and quantity stored for maize, beans and groundnuts. Frequency were run using SPSS and Chi square test to determine the associations of farm input, such as fertilizer application, and activities such as weeding that are associated to production of maize, beans, groundnuts and vegetables. Logistic regression analysis was used to determine the variable which is more associated than the other, if all variables of fertilizers application and weeding are put together.
Keywords
Monitoring Food Security, Information Asymmetry, Food Production, Participatory Programme Planning, Target Plan, Community Nutrition
Received: April 10, 2015
Accepted: March 30, 2015
Published online: July 13, 2015
@ 2015 The Authors. Published by American Institute of Science. This Open Access article is under the CC BY-NC license. http://creativecommons.org/licenses/by-nc/4.0/
Contents
1. Introduction 1.1. Vision 1.2. Aim 1.3. Purpose of the Programme 1.4. Programme Objectives 1.5. Component/ Concept of Food Security That Was Planned and Monitored 1.6. Benefit of the Programme/ Project 1.7. Back Ground Information for ‘Bar A’ Sub Location 1.8. Problem Statement 1.9. Justification 1.10. Key Points from the Discussions in the Participatory Workshop 1.11. The Food Demand for ‘Bar A’ Sub Location 1.12. The Report on the Mini Baseline Indicated That 1.13. Criteria Used for Selecting the Most Preferred Crops That Meet the Dietary Needs 1.14. Fertilizers Application Rate PER Acre 1.15. CAN Application Rate 1.16. Seed Rate Application Rate 1.17. Harvest PER Acre 1.18. Getting the Total Area of Arable Land (Land Used for Farming) 1.19. Rationing of Land for the Four Crops in 845 Acres of Land 2. Methodology 2.1. Study Site 2.2. Study Population 2.3. Target Population 2.4. Study Design 2.5. Sample Size Determination 2.6. Data Collection Tools and Quality Assurance 2.7. Inclusion Criteria 2.8. Exclusion Criteria 2.9. Data Management 2.10. Data Analysis 2.11. Monitoring 2.12. Dissemination of Findings and Expected Application of the Study Results 3. Findings 3.1. Area of Arable Land 3.2. Acreage Ploughed Maize 3.3. Acreage Ploughed Beans 3.4. Maize Stored by Households 3.5. Households Storing Groundnuts 3.6. Households Storing Kales 3.7. Households storing Maize 3.8. Households Storing Groundnuts 3.9. Quantity Stored Kales 3.11. Acreage Ploughed Beans 3.12. Maize Harvest 3.13. Beans Harvest 3.14. Groundnuts Harvest 3.15. Kales Harvested 3.16. Logistic Regression Analysis 4. Discussions 4.1. The Rationing of Land Should Have Been as Follows 4.2. Using the Standard of Harvest Based on the Literature Reviewed, Brainstorming and Discussions During the Participatory Workshop Which Was as Follows 4.3. Arable Land 4.4. Acreage Ploughed 4.5. Seed Rate Application 4.6. In CAN 4.7. In DAP 4.8. In Acres Weeded 5. Conclusion Recommendation Acknowledgement
1. Introduction
Agricultural projects have a profound effect on household food security and nutritional well-being. Food security, or uninterrupted physical and economic access to sufficient food for dietary needs and a productive and healthy life, is an important prerequisite for improving the nutrition of vulnerable groups such as women and children.
Inadequate food security and nutrition takes an enormous toll on economies and have negative consequences on the livelihoods and economic capabilities of vulnerable populations11.
In this field of food and income security, this project has adopted the use of a noticeboard, a positioning concept from community health strategy, which uses chalkboard as Community Based Health Information system (CBHIFS) to monitor health status in the community and have bear successful results in improving quality of health service delivery and improved health programs9.
1.1. Vision
To reduce malnutrition by improving food and income security in ‘Bar A’ sub location, Kisumu County.
1.2. Aim
The aim of this programme is to develop knowledge which will be used by policy makers, government agencies and the communities in Kenya to make use of abundant community cohesion resources to address problem of malnutrition and poverty by helping to meet the consistent growing demand for climatic adoptable locally grown food.
1.3. Purpose of the Programme
To facilitate community members in identifying food which is socially and culturally preferred by them and meets the nutritional needs of a person and help them to plan by mobilizing the available resources in order to improve the food security need of a household and to increase their income.
1.4. Programme Objectives
1. To conduct participatory planning with the Ministry of Agriculture and the various stakeholders in formulating the target of Community Food and Income Security Plan (CFISP) based on the available resources and the capacity of the land to produce and to use billboard as a tool to display the plan in a central place accessible to the communities’ members.
2. To establish the food security situation by conducting a baseline survey.
3. To monitor and evaluate the food security status by conducting a household interview and regularly update the findings on the food security reporting tool displayed on the noticeboard.
4. To have a dialogue with the community and discuss with them the relevant issues hindering them from not achieving the target plan and then train them on these modules.
1.5. Component/ Concept of Food Security That Was Planned and Monitored
1. The food security concept in this context referred to food that is socially and culturally acceptable and meets the dietary needs of the community1.
2. During participatory planning, the concept of ‘socially and culturally acceptable’ was used to ascertain preferred food crops through prioritizing the foods that the community prefer by using preference method to select the preferred four crops that are nutritious in protein, carbohydrate and vitamin and one that is cash crop8.
3. The component of commercial agriculture was also incorporated in the plan.
The project used the noticeboard as a tool to monitor and evaluate food security in Nyahera location. The noticeboard located at a place accessible to the community members displayed two tools on it. That is the target Community Food and Income Security Plan (CFISP) and the Community Food Security Reporting Tool (CFSRT).
The two tools provided information on the crops that the communities’ choose as the most commonly grown food and cash crop in their community. The food and cash crops selected were food and cash crops sustained by rainfall and therefore, tree plantation was also planned for and monitored for the purpose of sustaining the harvest of these crops in future through rainfall harvest by use of tree canopy to attract rain.
The plan was prepared based on the information from literature review.
Information from the literature review was used to get the standard quantity needed per acre on the following variables, which is the quantity of seeds, fertilizer, manure, pesticides and fungicide used.
The tree used a policy of 10% coverage to get the quantity of trees that needs to be planted.
The acreage to be allocated for each crop was determined by two ways
a. In the first participatory workshop after conducting a mini baseline. The acreage was determined by getting acreage of the whole land in ‘‘Bar A’ sub location and then determines acreage of arable land by working out 60% of the whole land. Then division is done for each crop by letting members to determine the percentage they normally allocate to each crop in their farms. Kisumu district development plan was used to provide information related to the acreage of arable land in ‘Bar A’ sub location and its population. The acreage of arable land helped in calculating the quantity of food that the community is capable of producing.
b. In the second participatory workshop, which took place after main baseline survey, we used the baseline findings to get valid acreage of arable land and percentage allocation of crops from the baseline survey. The findings from the main baseline also assisted in modifying the previous indicators made in the first participatory planning to correspond with the acreage of arable land and the rationing of crops.
The 2010 UN report provided us with information on the quantity of food that a person can consume in a day, so that using the population; we can work out the quantity demanded by the community in a year. The quantity of food demanded by the community and the actual food production shall help the community members to determine the existing gap in between the food demanded and the food produced.
These factual (literature review information) and actual information (Information from the main baseline) was used in the participatory planning to make a target plan for the community.
This target plan corresponds with a blank reporting tool which reports the actual findings from the field. The contrast on the two tools shall help in identifying challenges which enables the community to identify relevant modules that need to be incorporated in the community college curriculum.
Based on the strategies in the Kisumu District Poverty Reduction Strategy Paper, a consultation report for period 2001 to 2004 and the medium term expenditure framework poverty reduction strategy paper 2001, we developed a sample of the objectives and log frame to be used for planning food security in’ Bar A’ sub location.
1.6. Benefit of the Programme/ Project
a) The target plan shall help farmers to plan well with the resources, based on the current low land fertility.
b) It will reduce malnutrition diseases and therefore improving the health of the people.
c) It shall help the community to increase their sales, thereby improving the agribusiness and income level in the community hence having an impact on increase in enrolment for education.
d) The monitoring and assessment update shall help the community to know if they are on track or out in terms of meeting the food security target.
e) The increase of trees plantation per acreage of land shall increase and sustain the rainfall amount enough to sustain yield for the climatic adaptable food crops.
f) It will develop knowledge which will be used by policy makers and government agencies to make policy relevant in solving food insecurity.
1.7. Back Ground Information for ‘Bar A’ Sub Location
Nyahera location is in Kisumu West District, Kisumu County in the larger Nyanza region. It comprise of ‘Bar A’ sub location. It is majorly comprised of both rural and urban set up that constitute mostly of small scale farmers.
1.7.1. Land Tenure System and Use
Bar A sub location has a freehold tenure and most families inherit the land from their parents as it is typically a rural set up. This make the rural settlement to catch up in urban expansion .It resulted to massive concentration of people in a rural like urban environment with Luo housing style6.
1.7.2. Population Characteristic
‘Bar A’ as a sub-location is in Kisumu County which is a metropolitan city in the Republic of Kenya and it has a population of about 5,835 people. Children under the age of one year are 201 and children under the age of 5 years are 931. The number of village elders is 7, and these villages include Osembe, Geta, Sidika, Buoye and Dago market. The languages spoken in the area are English Kiswahili and as well ethnic language6.
1.7.3. Climate
The district has an annual relief rainfall that ranges between 1200mm and 1300mm in different sectors. The rain mainly falls in two seasons. Kisumu is warm through out the year with a mean annual temperature of 23°C. The temperature ranges between 20°C and 35°C but seldom falls below 19°C. The altitude ranges is 990-1470 meters above sea level. The humidity is relatively high throughout the year3.
1.8. Problem Statement
In the last decade, Kenya has increasingly faced food deficits as a result of an increase in the frequency of drought which has exacerbated the country food insecurity. Famine relief has become a regular feature in some parts of the ASAL area. This is happening despite the focus of the country food policy, to maintain strategic food reserves by purchasing maize surplus, the level of stock could not be attained due to insufficient production and inadequate funds4.
Lack of effective early warning and food information systems to mitigate floods, drought, pests and diseases, lack of effective control of crops and livestock’s diseases, land problems in term of fertility, size, fragmentation and land tenure system, lack of appropriate farm management skills, high cost of agricultural inputs and implements, inadequate research and utilization of research findings and high post-harvest losses are some of the constraints Kenya is facing in attaining food security target 4.
The magnitude of hunger (food deprivation) as measured by the prevalence of undernourishment shows that in 2005/06, about one person out of two was undernourished in Kenya. About 51 percent of the population had food consumption at 1261 kcal/ person which is below the Minimum Dietary Energy benchmark of 1683 kcal/person/day (MDER) 6.
Dietary diversity in Kenya shows that the country’s average dietary energy consumption consisted of 12 percent proteins, 21 percent fats and 62 percent carbohydrates. Kenya is still fairly within the recommended World Health Organization standards for balanced diet, consisting of 10-15 percent proteins, 15-30 percent fat and finally 55-75 percent carbohydrates6.
According to the U.N. FAO 2010, 6.1% or about 3,467,000 ha of Kenya is forested, according to FAO. Of this 18.9% (654,000) is classified as primary forest. Change in Forest Cover: Between 1990 and 2010, Kenya lost an average of 12,050 ha or 0.32% per year. In total, between 1990 and 2010, Kenya lost 6.5% of its forest cover, or around 241,000 ha 10.
According to a research conducted by KNBS 2008, it reveals that in Kenya, 286.1 g of maize is consumed by one person in a day. The total annual consumption for one person is 286.1 * 365 = 104,426.5 grams 5.
Therefore, the total annual demand of maize in ‘Bar A’ sub location is 104,426.5 ×5,835 = 609,325.710 Kg. This is equivalent to 6770 bags.
Despite huge food demand, the harvest is low. An acre has a capacity to produce 2,100 kg, 350 kg, 182 kg, and 1350 kg of maize, beans, groundnuts, and vegetable consecutively. From our baseline survey, the production from an acre is 237kg, 63kg, 175kg, 629kg of maize, beans groundnuts and vegetables consecutively. The deficit between the standard and real production is quite enormous in maize production than the other crops, and these production might continue to reduce drastically if nothing is done about it.
1.9. Justification
The variables being monitored by the project, agrees with the proposed strategy in the Kisumu District Poverty Reduction Strategy Paper, a consultation report for period 2001 to 2004. The strategies in the report include early land preparation, proper choice of the seed for different ecological zones and use of hybrid certified seeds, timely harvesting, use of fertilizer, and high rate of application2. Irrigation has been added since it’s a new policy in the Agricultural Sector Development Strategy 2010 to 20205. The issue of plant population is a major concern due to the fact that most farmers are not aware of the plant population in a given acreage of land. Therefore, the quantity of seeds used per acreage shall be planned for and then monitored.
According to medium term expenditure framework poverty reduction strategy paper 2001, maize production will be increased through the strategy of increasing supply of quality maize seeds, addressing the issue of high costs of farm inputs and implements, reducing post-harvest losses through promotion of appropriate storage facilities, improving crop husbandry by utilizing the research findings more effectively2.
The government has a policy of maintaining strategic food reserves in the form of physical stocks of 3 million bags of maize and US dollars of 60 million in cash.
Because of the many problems faced in the management of indigenous forests, Farm forestry seems to be the only way forward to meet the future wood demands in Kenya. It is only the farmers who can help close the foreseeable gap between supply and demand of wood and other forest products. It is anticipated that farms and settlement will contribute between 77-80 per cent of the total projected wood production in high potential and medium potential areas between 2002 and 2020 (KFMP 1994)10.
1.10. Key Points from the Discussions in the Participatory Workshop
Participatory workshop planning was conducted together with the knowledgeable farmers, Ministry of Agriculture staff; agro vets specialists and the County representatives. This took place in Nyahera chief camp in Kisumu West Sub County. Below is what was discussed.
1.11. The Food Demand for ‘Bar A’ Sub Location
According to the UN 2010 report, a research that was done in Nairobi showed that a person in Kenya eats a minimum of 286grams of maize in a day, hence 104.4kg in a year.
Therefore, a household with 5 members need to harvest a minimum of 5 bags. From the meeting, the members testify that most of them do not harvest the quantity of bags equivalent to the number of the household members.
To get the number of people who consume solid food, it’s important to subtract the population of infants who are less than year old.
5835 -201= 5634 people
5634* 104.4 kg= 588,189.6kg
588,189 divide by 90kg is equal to 6,535.44 bags of maize.
Therefore, 6,535.44 bags of maize are demanded in ‘Bar A’ sub location.
1.12. The Report on the Mini Baseline Indicated That
1. Most commonly grown crops are Maize, beans, groundnuts and few farmers are planting vegetables.
2. Most farmers plant in one acreage of land and half acreage of land.
3. Seed rate application is not uniform. Different household use different rate of seed application.
4. Most farmers are using DAP but not CAN.
5. The harvest is very low compared to the standard harvest.
1.13. Criteria Used for Selecting the Most Preferred Crops That Meet the Dietary Needs
Table 1 below was used to select the most preferred crops that meet the dietary needs.
1.14. Fertilizers Application Rate PER Acre
DAP FERTILIZER
Maize ------------------ 50 kg/acre
Beans--------------------- 100 kg/acre
Groundnuts-----------------100 kg/acre
Vegetables-------------------80 kg/acre
Trees----------
Beans--------------------500 g of foliar spray
1.15. CAN Application Rate
Maize ------------------------120 Kg per acre
Beans-------------------------500 g of foliar spray
Groundnuts-----------------500 g of foliar spray
Vegetables-----------------41 Kg per acre.
1.16. Seed Rate Application Rate
Maize------------------------10 kg per acre
Beans----------------------20 kg per acre
Groundnuts--------------20 kg per acre
Vegetables---------------200 g per acre
1.17. Harvest PER Acre
Maize----------------------30 bags per acre
Beans ---------------------- 5 bags per acre
Groundnuts--------------- 2.6 bags per acre
Vegetables----------------1350 kg per acre ie 15bags per acre
1.18. Getting the Total Area of Arable Land (Land Used for Farming)
Total area of’ Bar A’ is 1581 acres.
We used an estimation of 60% of this is as arable land.
Therefore 950 acres is arable land, considering that the remaining area constituting of 40% is covered by houses, roads, rivers etc.
10% of 950 needs to be covered by trees and this make it to 95 acres covered by trees.
This means that 95 acres need to be covered by trees.
Therefore, the remaining land for farming is 950 – 95 = 845 acres.
1.19. Rationing of Land for the Four Crops in 845 Acres of Land
In the first participatory planning, rationing of land for maize, beans, groundnuts and vegetables, was deliberated on based on the findings from the mini baseline. The rationing was in the percentage of 70%, 10%, and 15% of maize, beans, vegetables and groundnuts respectively. For the purpose of validity, this rationing was reviewed in the second participatory planning by using the information from the main baseline survey.
Maize and beans-------70% of the land and therefore the coverage is 595 acres
Vegetables----------------10% i.e. 85 acres
Groundnuts---------------15% i.e. 127 acres
Livestock------------------5% i.e. 43 acres.
2. Methodology
2.1. Study Site
Monitoring took place in ‘Bar A’ sub location. ‘Bar A’ has a population of 5835 people with households’ count of 1268.
Preference ranking table
Table 1. It shows how the concept of socially preferred food in different nutrition category was attained.
| Type of Crops Grown In Each Dietary Group | No of People Who Thinks That It’s The Preferred Crop In The Sub location | NO |
| CABOHYDRATE | ||
| Maize | 14 | 1 |
| Casava | 0 | |
| Sweet potato | 0 | |
| Sorghum | 0 | |
| PROTEIN | ||
| Beans | 12 | 1 |
| Green grams | 0 | |
| Soya beans | 0 | |
| VEGETABLES | ||
| Kales and cowpea | 14 | 1 |
| CASH CROPS | ||
| Groundnuts | 14 | 1 |
2.2. Study Population
This study population consisted of 641 farmers practicing farming in the whole sub location.
2.3. Target Population
The target population for this study was, a farmer who is the head a household i.e. either the wife or the husband. The unit of observation is the food being produced by these farmers.
2.4. Study Design
This shall be a longitudinal study that shall monitor the same households for a long period of time.
Strategies put in place include the following
2.4.1. Mini Baseline Survey
• This was done by selecting 50 households randomly in the sub location. That is on the Northern, Eastern, Western, Southern and central part of the sub location. These households were asked specific questions on the same tool to be used in monitoring.
• The mini baseline helped to determine the major crops that are grown by the community members.
• It also helped to determine the proportional ratio allocated for the crops to be planned for.
2.4.2. Literature Review
• The preferred crops chosen in the workshop through preference method, a literature review was done on the variables that need to be planned for and be monitored. The literature review helped us to quantify the indicators in the logical framework and the information displayed in the noticeboard.
• The variables to be planned for were borrowed from the justification of the programme. (Ref Kisumu District Poverty Reduction Strategy Paper, a consultation report for period 2001 to 2004). These include: - early land preparation, proper choice of seeds, use of hybrid certified seeds, timely harvesting, use of fertilizers, high and low rate seeds and fertilizers application. This first round of monitoring major on seeds, fertilizers and pesticides application.
2.4.3. Participatory Workshop Planning
• The participatory planning was done for the purpose of the community owning the displayed plan on the noticeboard.
• Information from the literature was used to facilitate in developing a logical framework with the help of the stakeholders.
• The relevant stakeholders who attended the participatory planning included the Ministry of agriculture staff, chiefs, other CBOs officials, agro vets, veterinary doctors, Community Health Workers and successful farmers in the community. Invitation letters were written to them for their attendance and participation.
2.4.4. Develop Baseline Tool
• Indicators in the logical framework were used to develop a questionnaire tool.
2.4.5. Conduct Baseline Survey
• Only households practicing farming were surveyed.
• The survey was done by trained CHWs belonging in the community.
• Importance of the survey was to build rapport with the household for the purpose of conducting a longitudinal study.
2.4.6. Second Participatory Workshop Planning
• This was for the purpose of modifying and integrating the findings from the survey with the already developed plan on the acreage of land/ ratio.
2.4.7. Monitoring
• Monitoring has been done frequently for the two seasons by use of household monitoring tool, and updating the notice board.
• Using household monitoring tool, the CHW walk house to house as they collect the data.
• In case of phone SMS interview, the community shall be expected to use their own cash to reply the sent SMS. This plays out in empowering them to own the information displayed on the billboard.
2.4.8. Assessment
• This shall be done through dialogue to identify the challenges and to come up with solutions that can help them to solve the food insecurity problem.
2.4.9. Training and Field Demonstration
• Train them on the challenges hindering them from achieving the target.
• Identify a serious farmer with a good record on farming in the community and organize for a field demonstration on his farm.
2.4.10. Monitoring and Assessment
Monitoring was supposed to be done by conducting an interview in either of the two methods below. The first method below was used to monitor food security. The second method could not be used due to limited resources.
1. Use of household tool pamphlet. Each pamphlet had at least 40 households questionnaire tool. These were made for each CHW who is attached to at least 40 households.
2. Use of SMS through mobile phones. For the purpose of owning and using the information, the community shall be expected to use their own cell phone airtime to reply the SMS. If this does not work, the CHW will take a role of using android phone to collect the information in the community and relay it to the central server for analysis.
2.4.11. Updating the Bill Board
Because of the manual update, the noticeboard was updated after every four months. Chief barazas, churches and funerals were used to encouraged the community members to update themselves with the billboard so that they can monitor their farming activities.
2.4.12. Assessment/ Dialogue
At the end of harvest, community members assembled together in a dialogue meeting, so that they can dialogue on the various issues that are hindering them from achieving the set target.
2.4.13. Training
The issues raised as challenges, formed part of the modules to be incorporated in the training curriculum so that they can be taught on the chosen modules.
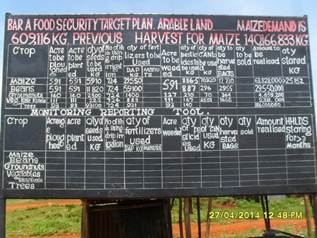
Fig. 1. Notice board before updating.
Upper table display the target plan and lower table display a blank table to be updated
2.4.14. Organise Demonstration Farms
Because of lack of funds, this activity has not yet been implemented. A farm needs to be identified within the community. It needs to be divided into four sections with different applications.
Section A shall major in planting crops purely by use of manure
Section B shall plant crops by using manure and fertilizers
Section C shall plant crops by using fertilizers only.
Section D shall not be used for anything.
These farm demonstrations shall enable farmers to see by themselves the importance of manure and fertilizers.
2.5. Sample Size Determination
This was a census study in which all the farmers in the sub location were included in the study.
2.6. Data Collection Tools and Quality Assurance
Data was collected through structured and semi structured questionnaires which are written in English. Pre-tests were done in the nearby community for clarity, acceptability, flow and consistency of the study. The questionnaire was used to collect quantitative data from the households.
Data collection was done by trained enumerators who had a minimum of certificates in Community health and Development or above and at least two years experienced in surveys. They underwent training for a period of three days.
Around 640 households were interviewed. Quantitative data were collected through structured questions and were collected for period of two days. Each enumerator interviewed at least 40 households. By the end of the day, the supervisors reviewed the questionnaires for consistency and completeness of data. Finally, all the questionnaires were entered.
2.7. Inclusion Criteria
For a household to be included in the study, it needs to have met the following criteria.
1. Need to be practicing farming
2. Land location shall not matter, that is either if the farmer is having a land within the sub location or outside the sub location. Implication is in line with that scenario of a farmer who resides within ‘Bar A’ sub Location but this same farmer has his farm
3. outside ‘Bar A’ Sub location; his farm is still included in the study.
2.8. Exclusion Criteria
1. Households to be excluded from the study are:-
2. Households that do not practice crop production farming.
3. Households that will not stay more than one year.
2.9. Data Management
Immediately after field work, data were entered on daily basis by the data clerks. Consistency and completeness check was done and data cleaned. Information from the questionnaires was electronically entered in Statistical Package for Social Sciences (SPSS) version 16 programme. All the hard copies of all questionnaires were used for counter checking the information electronically entered. Each tool was entered individually.
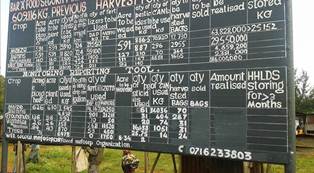
Fig. 2. Noticeboard updated for the first season before completion of full harvest is realised.
All indicators reported are lower than the target plan apart for acres ploughed and planted for maize and CAN used for beans and groundnuts.
2.10. Data Analysis
This was an analytical study in which quantitative data was used. The analysis is purely descriptive and trend analysis. Frequencies were run using SPSS; a computer based software for data analysis. Microsoft Excel was used to get the total summation displayed on the noticeboard.
Fig. 3. Noticeboard updated for the first season after completion of full harvest.
Quantity harvested is still much lower than the target plan apart from groundnuts having a less difference.
Chi square test was used to determine an association for different variables with the quantity harvest. Logistic regression analysis was used by combining all the variables together in order to find the variable with more association than the other.
2.11. Monitoring
This is done by use of a household monitoring tool inform of a pamphlet with one pamphlet having at least 40 households monitoring tools bound in it. One CHW is attached to at least 40 households that he or she monitors regularly using the pamphlet bound. Microsoft Excel was use to get the summation of the aggregates and then displayed on the noticeboard.
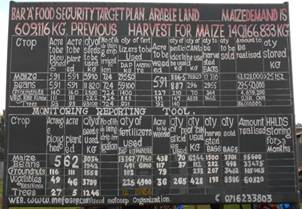
Fig. 4. Noticeboard updated for the second season.
The indicators in quantity harvested in the four crops are lower than the set target.
2.12. Dissemination of Findings and Expected Application of the Study Results
The findings are updated after every four month at the notice board. It is updated at the Community Food Security monitoring tool, which is displayed on the notice board.
3. Findings
According to table 1, Household with 1 to 6 members have the highest frequency of 527 (74.86%) followed by 7-12 member households recording 24.01% and 13-17 member households recording 1.14%.
On acreage of arable land, 0.05 to 1 acreage, recorded the highest frequency of 417 at 71.40% followed by 2-3 member households recording a frequency of 146 at 25% and 4 to 25 acres recorded a frequency of 21 at 3.60%.
On acreage ploughed maize, 0.05-1 acreage recorded the highest frequency of 366 at 51.40% followed by 1.5 -12 acreage recorded the lowest frequency of 133 at 18.68%.
On acreage ploughed beans, 0.125 – 0.5acreage recorded the highest frequency of 288 at 55.81% followed by 0.6-1.25 household members recording a frequency of 207 at 40.12% while 1.5 – 12 acreage recording a frequency of 21 at 4.07%.
3.1. Area of Arable Land
On table 2, area of arable land, the p-value 0.001 is less than 0.05 and therefore there is association in the acreage of arable land and total household members.
In acreage of arable land in a range of 0.05-1, household members in a range of 1-6 recorded the highest at 77.97% followed by 7-12 household members recording 21.79% and 13-17 household members recording 0.24% respectively.
In acreage of arable land 2-3, total household members of 1-6, recorded the highest at 64.58% followed by 7-12 recording 32.64% and 13-17 household members recording 2.78%.
In 4-25 acreage of arable land, 7-12 household members recorded the highest at 50% followed by 1-6 household members recording 45% and then 13-17 household members recording 5%.
Table 2. Showing frequency and percentage of total household members, acres of arable land, acres ploughed for maize and beans.
| Variable | Frequency | Percentage |
| total_hhm1 | ||
| 1-6 | 527 | 74.86 |
| 7-12 | 169 | 24.01 |
| 13-17 | 8.0 | 1.14 |
| acrea_arableland | ||
| 0.05-1 | 417 | 71.40 |
| 2-3 | 146 | 25.00 |
| 4-25 | 21 | 3.60 |
| acreageploughed_maize | ||
| 0.05-1 | 366 | 51.40 |
| 0.6-1.25 | 213 | 29.92 |
| 1.5-12 | 133 | 18.68 |
| acreageploughed_beans | ||
| 0.125-0.5 | 288 | 55.81 |
| 0.6-1.25 | 207 | 40.12 |
| 1.5-12 | 21 | 4.07 |
3.2. Acreage Ploughed Maize
In the same table 2, acreage ploughed maize in a range of 0.05-0.5acres; total household members in a range of 1-6 members recorded the highest at 81.23% followed by 7-12 member households recording 18.49% and 13-17 member households recording 0.28%.
In acreage ploughed in range of 0.6-1.25 acres, total household members of 1-6 household members recorded the highest at 72.95% followed by 7-12 household members recording 25.60% and 13-17 household members recording 1.45%.
In the range of 1.5- 12 acreage ploughed, 1-6 household members recorded the highest at 59.23% followed by 7-12 household members recording 37.69% and 13-17 household members recording 3.08%.
3.3. Acreage Ploughed Beans
In the same table 2, in acreage ploughed beans, 0.125-0.5 acres, 1-6 household members recorded the highest at 82.21% followed by 7-12 household members recording 17.44% and 13-17 household members recording 0.36%.
In 0.6-1.25 acres ploughed beans, 1-6 household members recorded the highest at 69.65% followed by 7-12 household members recording 28.36% and 13-17 household members recording 1.99%.
In the same table 2, in acreage ploughed beans for 1.5 -12 acres, 1-6 household members recorded the highest at 57.14% followed by 7-12 household members recording 33.3% and 13-17 household members recording 9.52%.
3.4. Maize Stored by Households
On households storing maize for one month, 1-6 household members recorded the highest at 73.53% followed by 7-12 household members recording 24.26% and 13-17 household members recording 2.21%.
On households storing maize for 2 months, 1-6 household members recorded the highest with 75.13% followed by 7-12 household members recording 23.99% and 13-17 household members recording 0.88%.
3.5. Households Storing Groundnuts
On households storing groundnuts for one month, 1-6 household members recorded the highest at 70% followed by 7-12 household members recording 25% and then 13-17 household members recording 5%.
On households storing groundnuts for two months, household members of 1-6 recorded 75.11% followed by 7-12 household members recording 23.87% and then 13-17 household members recording 10.02%.
3.6. Households Storing Kales
On households storing kales for one month, 1-6 household members recorded the highest at 76.92% followed by 7-12 household members recording 23.8% and 13-17 household members recording 0%.
On households storing kales for 2 months, 1-6 household members recorded the highest at 74.93% followed by 7-12 household members recorded 23.91% and 13-17 household members recording 1.16%.
3.7. Households storing Maize
On maize stored, the p-value 0.723 is more than 0.05 and therefore this signifies no association between maize stored and number of household members.
3.8. Households Storing Groundnuts
On groundnuts stored, the p-value 0.203 is more than 0.05 and therefore there is no association between groundnuts stored and number of household’s members.
3.9. Quantity Stored Kales
On kales stored, the p- value 0.504 signifies no association between kales stored and number of household members.
3.10. Acreage Ploughed Maize
According to table 2, the acreage of maize ploughed, the p-value 0.001 is less than 0.05 and therefore there is an association in the acreage of maize ploughed and number of household members.
3.11. Acreage Ploughed Beans
According to table 2, the acreage ploughed beans, the p-value 0.001 is less than 0.05 and therefore this signifies an association in the acreage of beans and number of household members.
Table 3. It shows proportion and p-value of different number of households’ members in different ranges, owning different ranges of arable land, ploughing different ranges of maize, beans and storing maize, groundnuts and kales.
| Variable | Total HHm | P-value | ||
| 1-6 | 7-12 | 13-17 | ||
| acrea_arableland | ||||
| (0.05-1) | 322(77.97) | 90(21.79) | 1(0.24) | |
| (2-3) | 93(64.58) | 47(32.64) | 4(2.78) | |
| 4-25 | 9(45.00) | 10(50.00) | 1(5.00) | <0.001 |
| Acreage ploughed maize | ||||
| 1 ( 0.05-0.5) | 290(81.23) | 66(18.49) | 1(0.28) | |
| 2 ( 0.6-1.25) | 151(72.95) | 53(25.60) | 3(1.45) | |
| 3 (1.5-12) | 77(59.23) | 49(37.69) | 4(3.08) | <0.001 |
| Acreage ploughed beans | ||||
| 1 (0.125-0.5) | 231(82.21) | 49(17.44) | 1(0.36) | |
| 2 (0.6-1.25) | 140(69.65) | 57(28.36) | 4(1.99) | |
| 3 (1.5-12) | 12(57.14) | 7(33.33) | 2(9.52) | <0.001 |
| Households storing maize | ||||
| 1 month | 100(73.53) | 33(24.26) | 3(2.21) | 0.723 |
| 2 month | 426(75.13) | 136(23.99) | 5(0.88) | |
| Households storing groundnuts | ||||
| 1 month | 14(70.00) | 5(25.00) | 1(5.00) | |
| 2 month | 513(75.11) | 163(23.87) | 7(1.02) | 0.203 |
| Households storing kales | ||||
| 1 month | 10(76.92) | 3(23.08) | 0(0.00) | |
| 2 month | 517(74.93) | 165(23.91) | 8(1.16) | 0.504 |
3.12. Maize Harvest
3.12.1. Seed Quantity
In table 3, for the quantity of maize seeds planted, the P- Value is 0.001 less than 0.05. This signifies level of association of quantity of maize seeds planted and maize harvested.
3.12.2. CAN Quantity
For the quantity of CAN used for top dressing maize, the P-Value 0.001 is less than 0.05. This signifies some level of association between quantity of CAN used and quantity of maize harvested.
3.12.3. DAP Quantity
For the quantity of DAP used for planting maize, the p-value 0.045 is less than 0.05. This signifies some level of association between quantity of DAP fertilizers used and quantity of maize harvested.
3.12.4. Acre Weeded
On acreage of land weeded for maize, the p.value is 0.047 which is less than 0.05. This signifies some level of association between the acreage of land weeded with the quantity of maize harvested.
3.13. Beans Harvest
3.13.1. Seeds Quantity
For the quantity of beans seeds planted, the p-value 0.001 is less than 0.05 and therefore there is some level of association between quantity of seeds planted and quantity of beans harvested.
3.13.2. CAN Quantity
For the quantity of CAN fertilizer used for top dressing beans, the p-value is 0.051 and therefore this signifies no association between quantity of CAN used and beans harvested.
3.13.3. Acre Weeded
For acreage of land weeded for beans, the p-value 0.001 signifies some level of association with the quantity of beans harvested.
3.14. Groundnuts Harvest
3.14.1. Seed Quantity
For quantity of groundnuts seeds used for planting, the p-value 0.026 being less than 0.05 signifies some level of association.
3.14.2. CAN Quantity
For quantity of CAN fertilizer used for top dressing, the p-value 0.157 is more than 0.05 and therefore this signifies no association of the quantity of CAN used and quantity of beans harvested.
3.14.3. DAP Quantity
For quantity of DAP fertilizer used, there is no p-value value recorded and therefore, there is no association.
Table 4. It shows the association seed, CAN, DAP and acre weeded have with maize and beans harvested.
| QUANTITY KG | Maize harvest. (Kg) | Beans harvest (Kg) | |||||
| RANGE | 1(0.333-180) | 2(181-990) | p-value | 1(0.02-22) | 2(22.5 - 67.5) | 3(68 - 1800) | p-value |
| Seed Qty | <0.001 | <0.001 | |||||
| 0.25-2.25 | 40(16.26) | 206(83.74) | 32(27.83) | 56(48.70) | 27(23.48) | ||
| 2.5-8 | 138(31.72) | 297(68.28) | 54(36.99) | 45(30.82) | 47(32.19) | ||
| 9-50 | 72(60.00) | 25(20.83) | 23(19.17) | ||||
| CAN Qty | <0.001 | - | 0.051 | ||||
| 1-10 | 43(37.07) | 73(62.93) | 3(100.00) | 0(0.00) | |||
| 11-40 | 6(12.50) | 42(87.50) | 0(0.00) | 2(100.00) | |||
| 41- | 0(0.00) | 27(100.00) | 1(25.00) | 3(75.00) | |||
| DAP Qty | 0.045 | - | |||||
| 1-2 | 75(30.24) | 173(69.76) | |||||
| 2.5-40 | 52(25.62) | 151(74.38) | |||||
| 42- | 35(19.55) | 144(80.45) | |||||
| Acre weeded | 0.047 | <0.001 | |||||
| 0.125-0.75 | 59(21.30) | 218(78.70) | 103(46.82) | 82(37.27) | 35(15.91) | ||
| 1-2 | 60(31.41) | 131(68.59) | 41(33.61) | 32(26.23) | 49(40.16) | ||
| 2.5-5 | 5(26.32) | 14(73.68) | 8(14.81) | 18(33.33) | 28(51.85) | ||
Table 5. It shows the association seed, CAN, DAP and acre weeded have with groundnuts and kales harvested.
| Groundnuts harvest (90kg bags) | Kales harvest (90kg bags) | |||||||
| Range Seed Qty (Kg) | 1(0.5-22) | 2(23-135) | 3(136-1800) | p-value | 1(4-60) | 2(61-180) | 3(181-1620) | p-value |
| 0.125-15 | 7(25.00) | 6(21.43) | 15(53.57) | 0.026 | 0(0.00) | 0(0.00) | 2(100.00) | 0.677 |
| 16-26 | 10(27.78) | 16(44.44) | 10(27.78) | 2(50.00) | 0(0.00) | 2(50.00) | ||
| 28-30 | 1(14.29) | 0(0.00) | 6(85.71) | 7(46.67) | 1(6.67) | 7(46.67) | ||
| CAN Qty (Kg) | ||||||||
| 1-13 | 0(0.00) | 1(100.00) | 0.157 | 2(40.00) | 0(0.00) | 3(60.00) | 0.863 | |
| 14-30 | 1(50.00) | 1(50.00) | 2(28.57) | 1(14.29) | 4(57.14) | |||
| 30- | 1(33.33) | 0(0.00) | 2(66.67) | |||||
| DAP Qty (Kg) | ||||||||
| 0.5-3 | 1(33.33) | 1(33.33) | 1(33.33) | 7(77.78) | 0(0.00) | 2(22.22) | 0.119 | |
| 4-10 | 2(22.22) | 1(1.11) | 6(66.67) | |||||
| 11-25 | 1(25.00) | 0(0.00) | 3(75.00) | |||||
| Acre weeded | ||||||||
| 0-0.33 | 12(32.43) | 21(56.76) | 4(10.81) | |||||
| 0.5-1.25 | 10(14.93) | 31(46.27) | 26(38.81) | 0.013 | 8(42.11) | 1(5.26) | 10(52.63) | 0.300 |
| 1.5-3 | 6(30.00) | 6(30.00) | 8(40.00) | 0(0.00) | 0(0.00) | 3(100.00) | ||
Table 6. Questionnaire tool used by Community Health Workers to monitor food and income security in ‘Bar A’ sub location.
| Crop | Acreage ploughed | Acreage planted | Qty of seeds used | No of Hhds Using drip irrigation | Qty of fertilizers used | |
| DAP | Manure | |||||
| Maize | ||||||
| Beans | ||||||
| Veg | Kales | |||||
| Cow pea | ||||||
| Trees | ||||||
Continuation of table 6.
| Crop | Acreage ploughed | Acre weeded | Qty of pesticide used | Qty of CAN used | Qty harvested. | Qty to be sold | Amount Received | Qty stored | ||
| < 1 M | > 1M | >2M | ||||||||
| Maize | ||||||||||
| Beans | ||||||||||
| Veg | Kales | |||||||||
| Cow pea | ||||||||||
| Trees | ||||||||||
3.14.4. Acre Weeded
For acreage of land weeded for groundnuts, the p-value 0.013 signifies some level of association with the quantity of groundnuts harvested.
3.15. Kales Harvested
3.15.1. Seed Quantity
For quantity of kales seeds planted, the p-value 0.677 is more than 0.05; therefore, this signifies no association between quantity of seeds and quantity of kales harvested.
3.15.2. CAN Quantity
For quantity of CAN used for top dressing kales, the p-value 0.863 is more than 0.05 and therefore this signifies no association on quantity of CAN used and quantity of kales harvested.
3.15.3. DAP Quantity
For quantity of DAP fertilizer used, the p-value 0.119 is more than 0.05 and therefore this signifies no association between DAP fertilizer used and quantity of kales harvested.
3.15.4. Acre Weeded
For acreage weeded for kales, the p-value 0.03 is less than 0.05 and therefore this signifies an association between acreage of land weeded for kales and quantity of kales harvested.
3.16. Logistic Regression Analysis
Introduction
Logistic regression for all the combined variables that is quantity harvested maize, acre of maize weeded, quantity of CAN and DAP fertilizer used on maize and quantity of maize seeds.
Logistic regression analysis
Log likelihood
Number of obs = 142
LR chi 2 (4) = 11.16
Prob ≥chi 2 = 0.0248
Pseudo R2 = 0.3062
If all the variables are combined together, quantity of CAN has a stronger association, more than the other three variables. The odds ratio of acreage weeded for maize 5.084107 signifies that maize harvest can increase five times if acreage weeded increased.
The odd ratio of maize seeds used, 2.259601, signifies that maize harvest can increase two times if the quantity of seeds is increased.
Table 7. Shows results for logistic regression analysis for area weeded, quantity of CAN, DAP and seed used.
| Quantity harvested maize | Odds ratio | Std. Err | Z | P ≥(Z) | (95% Confidence Interval) |
| Acreage weeded for maize | 5.084107 | 6.082127 | 1.36 | 0.174 | .4874394 53.02843 |
| Quantity of CAN used for maize | 0.096144 | 0.0974263 | -2.31 | 0.021 | .0131938 7006099 |
| Quantity of DAP fertilizer | 0.9206543 | 0.6773176 | -0.11 | 0.911 | .2177082 3.893305 |
| Quantity of seeds used for maize | 2.259601 | 2.600811 | 0.71 | 0.479 | .2367527 21.56594 |
4. Discussions
According to table one, 1 to 6 household members records the highest frequency. This means that majority of the households have at least 6 members (?!). 7 to 12 member households have recorded a frequency almost a quarter of the whole population. According to FAO 1982, on the minimum consumption of maize by a person in a day, our harvest expectation for the 6 household members need to be 104,426.5×6 = 626.559kg or 7bags of maize.
According to table 1, most farmers own arable land in a range of 0.05 to 1 acreage. This signifies scarcity of land among these households. A quarter of the population owns land in a range of 2 to 3 acreage. Households owning land in a range of 2-3 and 4-25 acreage, stand a chance of reaping good harvest enough for both consumptions and cash sales, only if they use their arable land very well. According to the standard of harvest for maize, beans, groundnuts and vegetables, acreage of land under cultivation with good farming techniques, is capable of producing a harvest of 30 bags of maize, 5 bags of beans, 2.6 bags of groundnuts and 15 bags of vegetables.
4.1. The Rationing of Land Should Have Been as Follows
For land that are 1 acre and below, equitable rationing of land should have been as stated below, for the purpose of ensuring a balance meal and commercial farming that guarantees good community nutrition and income
Crops Equitable rationing of land
Maize intercropped with beans----------------70% of 1 acre should have ploughed 0.7acreas and below
Vegetables ----------------------10% of 1 acre should have ploughed 0.1 acres and below.
Groundnuts --------------------15% of 1 acre should have ploughed 0.15 acres and below.
4.2. Using the Standard of Harvest Based on the Literature Reviewed, Brainstorming and Discussions During the Participatory Workshop Which Was as Follows
If equitable rationing of land is done for one acre of land, therefore, by using the standard of harvest for maize, beans, groundnuts and vegetables; production of these crops in acreage of one and below is capable of producing the following harvest if good farm management practices are adhered to.
An acre intercropped with maize and beans in 0.7 acre of land and below, is capable of producing 21 bags of maize and 3.5 bags of beans.
An acre of groundnuts in 0.15 and below, is capable of producing 0.39 bags of groundnuts
An acre of vegetables in 0.1 and below, is capable of producing 0.26 bags of vegetables
Based on the above rationing of land for one acre of land, groundnuts and vegetables records a low harvest and these families are likely to engage less in cash sales and also less of vegetables in their daily meal unless they sale surplus of their maize production in order to purchase vegetables. This rationing of land for one acre of land, might not guarantee a balanced meal and commercial farming for the whole year.
Alternatively, rationing of land can be revised based on the number of household members in a household by using the minimum amount of maize, beans and vegetables a person can eat in a day, in order to work out the total amount of maize, beans and vegetables required for the whole year by that particular household.
In the findings of table 2, checking on the number of households members with arable land less than 1 acres, findings are as follows: 322 households are having less than 6 household members, 90 households are having less than 12 household members and 1 household is having less than 17 household members. This therefore means, given that good farm management practices are adhered to, then households with less than 6 members and 12 members can be able to revise rationing of their land based on the standard of harvest and the number of household members that needs to feed on that harvest, bearing in mind the minimum consumption a person needs for maize, beans and vegetables in a day. The remaining land can be allocated for some different food or cash crops or the surplus can be sold.
4.3. Arable Land
An arable land of 0.05 is only conducive to households with only one member but not to more than one household member, since its production is 1.5bags. Households with an arable land in the range of 0.05 -1 acre and have 13 to 17 members is likely to suffer from food insecurity, considering the fact that they need to ratio their land for vegetables and groundnuts.
4.4. Acreage Ploughed
Using table 2, based on the acreage ploughed, we can predetermine the amount that could have been harvested for maize and beans. According to the same standard of harvest per acreage for maize intercropped with beans, the harvest should have been as follows:
4.4.1. Acreage of Maize
In table 2, using the standard of harvest discussed in the participatory workshop, harvest of maize using 30bags of maize per acreage should have been as follows.
Households who had ploughed in the range of 0.05 to 1 acreage, should have harvested maize in a range of 1.5 bags for 0.05 acre and 15 bags for 0.5 acre.
In the same table, households who had ploughed in the range of 0.6 to 1.25 acre should have harvested in a range of 18bags for 0.6 acre and 37.5 bags for 1.25acre.
In the same table, households who had ploughed in the range of 1.5 acre to 12 acres of land should have harvested maize in a range of 45bags for 1.5 acre and 360 bags for 12 acres of land.
According to table 2, household with members in the range of 1-6 members, recorded the highest households with less acreage of arable land in the range of 0.05 - 1 acres compared with the household with members in the range of 7 to 12 and 13 to 17 household members. This could be attributed by the consistent diminishing of land area due to many competing factors such as population growth stimulating competition for land usage on building of houses.
Land value in Nyahera is escalating and as a result of this, many household are not able to purchase more land and instead, they engage more in selling of their lands and this could be the reason why acreage of land in the range of 0.05-1 acres is more own by many households compared to an acre of arable land in the range of 2-3 and 4-25 acres
In table 2, the percentage of household able to store maize for one month, reduces as the numbers of household members increases in size. The same also applies for quantity stored in two months. This is attributed to the fact that with many household members, results to increase in quantity of food demanded and consumed. This result to early completion of food stored for consumption hence leading to food insecurity.
4.4.2. Acreage of Beans
In table 2, according to the standard of harvest discussed in the participatory workshop, the harvest for beans using 5 bags per acre, should have been as follows:-
Households who had ploughed in the range of 0.125 to 0.5 acres, should have harvested in a range of 0.625 bags for 0.125 acres and 2.5 bags for 0.5acres.
Households who had ploughed in the range of 0.6 to 1.25 acres, should have harvested in a range of 3 bags for 0.6 acres and 6.25 bags for 1.25 acres.
Households who had ploughed in the range of 1.5 to 12 acres, should have harvested in a range of 7.5 bags for 1.5 acres and 60 bags for 12 acres.
In table 3, usage for seeds is still very low compared with the standard plan which was discussed in the participatory workshop planning as stated below.
4.5. Seed Rate Application
Maize----------------------10kg per acre
Beans----------------------20kg per acre
Groundnuts--------------20kg per acre
Vegetables---------------200g per acre
According to the findings in table 3, no household used 10kg of maize seeds as required in the seed rate application, while in beans, there are those who use more than the standard rate of 20kg. In beans, some of the farmers who had used quantity of seeds in the range of 9kg to 50kg, majority at 60.00% still experience low harvest of 0.02kg-22kg. In table 4, for groundnuts, an average number of people used the required quantity of seed in the range of 16kg to 26kg. In groundnuts, the seed rate of application in the range of 0.125kg-15kg were able to record a higher percentage of households at 53.57% harvesting in the range of 136kg-1800kg compared with the group in the seed application in the range of 16kg-26kg, recording percentage of households at 44.44% harvesting in a range of 23kg-135kg.
4.6. In CAN
In table 4, as the quantity of the CAN used in maize increases in the range of 1kg-10kg, 11kg-40kg and 41kg- respectively, the percentage number of people experiencing harvest in the range of 181-990kg also increases respectively in the range of 62.93%, 87.50%, and 100% while the percentage number of people experiencing harvesting in the range of 0.333kg -180kg decreases respectively. This signifies that an increase in quantity of CAN has an increase in the quantity of harvest for maize.
People rarely use CAN in beans and groundnuts due to the fact that they fix nitrogen in the soil.
In vegetables, usage of CAN in a range of 1-13kg, records a percentage of 60% households experiencing harvest in a range of 181-1620kg. This percentage reduces to 57.14% in the range of 14-30kg usage of CAN. It then increases to 66.67% in the number of people using CAN above 30kg.
4.7. In DAP
In table 4, for DAP usage for maize, as the quantity in DAP uses increases in the range of 1kg-2kg, 2.5kg-40kg, 42kg-, the percentage number of people harvesting in the range of 181kg-990kg, increases in this range as follows 69.76%, 74.38%, 80.45% while there is a decrease in the percentage number of people harvesting in the range of 0.333kg -180kg. This signifies that an increase in the quantity of DAP, result to an increase in the quantity of harvest for maize.
In beans, there is none who uses DAP. The same also in groundnuts, only three people used DAP which recorded the same number of people experiencing a different quantity in the different range of 0.5kg-22kg, 23kg-135kg, 136kg-1800kg.
In vegetables, the lowest range of quantity of DAP, in the range of 0.5kg-3kg, recorded a percentage of 7% which is higher than 2% of the household who experience harvest in the range of 136kg to 1800kg. In the range of 4kg-10kg and 11kg to 25kg uses of DAP, the percentage of people experiencing harvest increases in the higher range of harvest of 136kg-1800kg.
4.8. In Acres Weeded
In table 4, in acres weeded in maize, the acres weeded in the range of 0.125-0.75 acres, recorded a high percentage at 78.70% of household harvesting in a range of 181-990kg. In 1-2 acres weeded, household experiencing harvest in the range of 181kg-990kg, recorded 68.59%. In acres weeded 2.5-5acres, percentage number of households experiencing harvest in the range of 181kg to 990kg recorded 73.68%. This increase in harvest applies in all the ranges of acres weeded and this could be attributed to the fact that an acre weeded, has a direct association to an increase in harvest.
In beans, in the range of acreage weeded at 0.125-0.75 acreage, there is a decrease in the percentage of household experiencing harvest in the range of 0.02-22kg, 22.5-67.5kg, 68-1800kg. This need further research, since beans being a cover crop, does not require much weeding for it to realise abundant harvest.
5. Conclusion
There is association in the acreage of arable land and total household members and this could be attributed by the consistent diminishing of land area due to many competing factors such as population growth stimulating competition for land usage on building of houses.
Association in the acreage of maize ploughed and number of household members and association in the acreage of beans and number of household members. This is basically attributed to the fact that, a household tries to meet the demand of food for his households members by ploughing a reasonable size of land that can meets their food demand.
Among the four crops monitored, that is maize, beans, vegetables and groundnuts, findings shows maize as the only crop that have an association with CAN and DAP fertilizers with the quantity harvested. This is attributed to the fact that beans and groundnuts have the capability of fixing nitrogen in the soil, so rarely do people use nitrogen.
The odds ratio of acreage weeded for maize 5.084107 signifies that maize harvest can increase five times if acreage weeded increased.
The odd ratio of maize seeds used, 2.259601, signifies that maize harvest can increase two times if the quantity of seeds is increased.
Recommendation
Farmers need to be educated on how to ratio their land for crop farming in an equitable way by using the number of household members to work out the amount of each nutritious food required and the size of land that needs to be allocated to each food crop.
There is need of the farmers to be educated on the quantity of fertilizers, seeds and pesticides required for an acreage of land.
Farmers need to be trained on the importance of weeding.
Acknowledgement
First, is much appreciation to God who is the giver of knowledge and wisdom. Thanks to my parents Mr and Mrs Jerry Aboka and all my Jerry’s brothers for their moral support since the onset of the project. I would like to appreciate Mr David Odero, for his availability during the establishment of the project, more so in providing company in all the visits made during the initiation process of MEFOSEP. Much appreciation to the following MEFOSEP group members:-, Maxwel Oyoo, Mojes, Sam Nicholas, Janet, Racheal, Dickens, Pastor Ken Odeny and Pastor Veronica for their voluntary contribution whenever they were called for.
The existence and contribution of the following partners, generated more success and much appreciation to them, that is:-, Ministry of agriculture staffs in Kisumu West Sub county, Community Health Workers and Community members in ‘Bar A’ sublocation.
Not to forget appreciating Winnie Otieno, Celestine Okang, Jeremy Nzanzu, Caro Akinyi and my mentor Dr Charles Wafula. Thank you all and my God bless you abundantly.
References
- Food and agriculture Organization of the United Nation (2003), Trade reforms and Food Security.
- GOK (2001), Kisumu District Poverty Reduction Strategy Paper, a consultation report for period 2001 to 2004.
- GOK (2008), Kisumu District Development Plan, 2008 to 2012.
- GOK (2001) Report of the sector working group on agricultural and rural development in Kenya.
- GOK (2010), Agricultural Sector Development Strategy 2010 to 2020.
- Kenya National Bureaus of statistics (2008), Food Insecurity Assessment in Kenya based on Kenya Integrated household budget surveys (2005/2006.)
- Kirichu S., (2013), SQUEAL report, OTP program, Kisumu East District, Kisumu county, Kenya.
- Maillot, M., Darmon N. and Drewnowski A (2009), Are the lowest cost healthful food plans culturally and socially acceptable?
- Nzanzu Jeremie., Dan Kaseje, Rose Olayo and Caro Akinyi (2014). Utilization of Community- based Health Information System in Decision making and Health Action in Nyalenda, Kisumu County, Kenya. Universal journal of medical Science.
- United Nation (2010), Food and Agriculture Organization.
- USAID (2012), Infant and young child nutrition project.


