Journal of Agricultural Science and Engineering, Vol. 1, No. 1, April 2015 Publish Date: Mar. 26, 2015 Pages: 17-21
Assessing Consumption Poverty in Wad Banda Locality, North Kordofan State, Sudan
Mohammed Abdalla Teabin1, *, Mohamed A. Ibnouf2
1Department of Agricultural Economics, Faculty of Agriculture, University of Zalingei, Zalingei twon, Central Darfur State, Sudan
2Department of Agricultural Economics, College of Agricultural studies, Sudan University of Science and Technology, Khartoum North, Sudan
Abstract
The main objective of the study is to analyze poverty situation in Wad Banda Locality, North Kordofan State, through using household’s consumption as welfare proxy. Because of the drawbacks of using quantitative data as a result of understatement and overstatement of quantitative data, the study used both quantitative and qualitative analysis. Field survey was conducted on June 2013 using questionnaire, group discussions, interviews and observation. Hundred households were chosen through simplified random sampling. Foster, Greer, and Thorbecke index (FGT index) was used as the main technique for measuring consumption poverty, besides Gini coefficient. Poverty indicators have been derived namely incidence of poverty (Headcount Index), poverty gap (depth of poverty), and severity of poverty using 1 USD (6 SDG) as poverty line. The findings of the study revealed that consumption poverty was less prevalent than income poverty in the area. Consumption was divided into two categories, consumption on food only as denoted by (C1) and total consumption which include food, education, clothes, health and others as denoted by (C2). The incidence of poverty was 74% regarding consumption on food only (C1), which is higher than Teabin (2010) results for Wad Banda locality which estimated the incidence of poverty using food consumption at 63%. Regarding total consumption (C2) the incidence of poverty fell to 62% which also higher than Teabin (2010) results which mentioned that the incidence of poverty in Wad Banda locality for total income was 35%.
Keywords
Consumption Poverty, Poverty Severity, Poverty Gap
Received: March 6, 2015
Accepted: March 23, 2015
Published online: March 26, 2015
@ 2015 The Authors. Published by American Institute of Science. This Open Access article is under the CC BY-NC license. http://creativecommons.org/licenses/by-nc/4.0/
1. Introduction
Poverty remains among the most important human rights challenges facing the world community. Based on equal worth and dignity of every individual, human rights are central to well-being. Freedom from want and fear constitutes the fundamental condition to enjoy that well-being, while freedom from discrimination forms the basis for social protection and effective participation in society" (UNICEF, 2000). Poverty is a multi-dimension concept. Experts and academics have suggested many definitions over time. For example, poverty could be the lack of command over commodities in general; alternatively, it could be the lack of command over some basic goods (e.g., food and housing). More generally, poverty is the lack of capability to function in a given society. All these definitions point to poverty as a status in which a reasonable standard of living is not achieved. (FAO, 2005, WB, 2005).
Haughton and Khandker (2009) argued that poverty is deprivation in wellbeing. But the questions arises what is wellbeing and how we measure deprivation. One approach is to think of well-being as the command over commodities in general, so people are better off if they have enough resources to meet their needs. A second approach to wellbeing is to ask whether people are able to obtain a specific type of consumption good: Do they have enough food? Or shelter? Or health care? Or education? Perhaps the broadest approach to wellbeing is the one expressed by Sen1987, who claims that wellbeing comes from a capability to function in society. Thus, poverty arises when people lack key competences; such have insufficient income or education, or weak health, or insecurity, or low self-confidence, or a sense of powerlessness, or the absence of rights such as freedom of speech.
1.1. Problem Statement
Three out of every four poor people in developing countries live in rural areas, and most of them depend directly or indirectly on agriculture for their livelihoods. Climate change and rising food prices are reminders of the need to focus on food security and agriculture for development. Agriculture is central to the livelihoods of the rural poor. Agriculture can be an engine of growth and is necessary for reducing poverty and food insecurity, particularly in sub-Saharan Africa. Advances in agricultural knowledge and technology that accompany the changes in the sector are creating an array of new choices for producers, altering what is produced, where it is produced, and how it is produced. Factors outside of the sector, such as widespread environmental change, are also altering agricultural potential throughout the world. Migration, arising mainly from poverty or prompted by natural disasters or violent conflicts form a dynamic force, changing the landscape of the rural population. Globalization and trade liberalization have opened more market opportunities internationally and have induced greater innovations and efficiencies in many cases. But, at the same time, globalization has led to painful transition periods for some economies and has favored the producers who have more resources and the information, education, and capacity to cope with increasingly stringent market demands (WB, 2009).
Sudan is a low-income country, with average GNI per capita USD 1450 (WB, 2012). With its vast geographic area and varied natural resources, it holds great economic potential. So far, it has been a land of missed opportunities. It is also a land of great diversity: ethnically, geographically and ecologically. The country faces the challenges of utilizing, capitalizing on such diversity to achieve development and eradicate poverty. The relatively low level of per capita income masks wide regional disparities in economic and social development. Educational levels are low, health conditions are poor, and the burden of disease is heavy and widespread. Infrastructure is either non-existent or underdeveloped and inadequate in lager parts of the country, (UNDP, 2006).
IFAD (2007) stated that about 19 million people in Sudan, 85 per cent of the rural population, are estimated to be living in extreme poverty. Most of them struggle to feed themselves and their families and have little or no access to safe drinking water and health services. The incidence of poverty varies considerably according to region. Severe inequalities in terms of access to education, sanitation and clean water, infrastructure and natural resources, income opportunities, justice and political protection exist between regions.
1.2. The Objective of the Study
This paper aims to analyze Consumption Poverty in Wad Banda Locality, North Kordofan State, through:
1. Identifying and describing poverty situation in the area.
2. Identify and analyze the causes of poverty.
1.3. Hypotheses of the Study
1. The majority of people in the study were poor.
2. Rain variability was the main cause of poverty in the area.
1.4. The Research Methodology
Both primary and secondary data were used in this study. The filed survey was conducted on June 2013. The field data was collected through questionnaires, group discussion, interviews and observation. Hundred household heads were chosen through simplified random sampling.
The main analysis technique for the study was Foster, Greer, and Thorbecke index (FGT index) which include incidence of poverty; poverty gap; and severity of poverty. Poverty indicators for consumption were calculated using (1 $) (6 SDG) as poverty line. Descriptive statistics, Lorenz Curve, and Gini Coefficient were also used in data analysis.
The FGT index for poverty analysis includes head count index, poverty gap, and poverty severity.
A. Head count index (P0)
World Bank (2003) stated that Poverty Headcount (Incidence of poverty) is the share of the population that is poor, that is, the proportion of the population for which consumption or income y is less than the poverty line. Suppose we have a population of size n in which q people are poor.
P0 = q/n
Where:-
P0 = the head count index; q = the number of households under poverty line; n = the total number of population or sample size.
B. Poverty Gap (P1)
The poverty gap, which is often considered as representing the depth of poverty, is the mean distance separating the population from the poverty line, with the non-poor being given a distance of zero. The poverty gap is a measure of the poverty deficit of the entire population in which the notion of poverty deficit captures the resources that would be needed to lift all the poor out of poverty through perfectly targeted cash transfers. It is defined as follows:
![]()
Where: P1= poverty gap, n = total population; z= poverty line; q = poor people; y i = income of individual i (yi is the income of individual i, and the sum is taken only on those individuals who are poor).
Severity index (P2)
Squared Poverty Gap is often described as a measure of the severity of poverty. While the poverty gap takes into account the distance separating the poor from the poverty line, the squared poverty gap takes the square of that distance into account. When using the squared poverty gap, the poverty gap is weighted by itself, so as to give more weight to the very poor. In other words, the squared poverty gap takes into account the inequality among the poor. It measures the distribution of welfare of those having income below poverty line. It can distinguish between poor and poorest (World Bank, 2003). It is obtained as follows"
Where: P2= Severity index, n = total population; z= poverty line; q = poor people; y i = income of individual i.
2. Farming System
The study showed that the main livelihood activities is traditional rain fed farming, besides animal raising, traditional gold mining recently, taping of Hahsab trees (Acacia Senegal) for collecting Gum Arabic. about 94 of household heads considered farming as main livelihood activity for them, while 5% considered it as secondary livelihood activity, and only 1% of household not depend on agriculture as livelihood activity either main or secondary activity, because it depend on casual working at the markets. Rain variability is main problem facing traditional rain fed farming activities.
Taha (2007) stated that Sudan has suffered a number of long and devastating droughts in the past decades. All regions have been affected, but the worst impacts have been felt in the central and northern states, particularly in North Kordofan, Northern state, Northern Darfur, Western Darfur, Red Sea and White Nile states. As a result, their population is highly vulnerable to effects of chronic and occasionally acute food shortages.
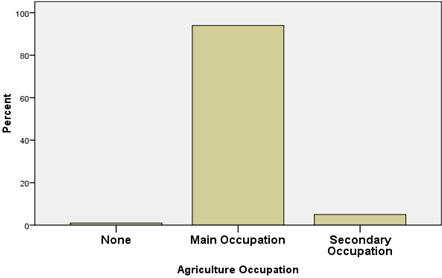
Source: Field survey, 2013.
Figure (1). Agricultural activity
3. Poverty Indicators
The poverty indicators for consumption have been derived namely incidence of poverty (Headcount Index), poverty gap (depth of poverty), and severity of poverty using 1 USD (6 SDG) as poverty line. Subjective poverty line was calculated using field survey data which was 8 SDG (1.3 $), however it is not used in calculating poverty indicators. People tend to overstate their consumption unlike for income by giving the supposed basic need consumption; however their actual consumption expected to be lower than mentioned figures as a result of austerity adopted by households. Therefore the accurate poverty indicators are expected to be between income poverty indicators and consumption indicators.
4. Consumption Poverty Indicators
The study revealed that consumption poverty is less prevalent than income poverty. Consumption was divided into two categories, consumption on food only as denoted by (C1) and total consumption which include food, education, clothes, health and others as denoted by (C2). The incidence of poverty was 74% regarding consumption on food only (C1), which is higher than Teabin (2010) results for Wad Banda locality which estimated the incidence of poverty using food consumption at 63%. Regarding total consumption (C2) the incidence of poverty fell to 62%, table (2) which also is higher than Teabin (2010) results which mentioned that the incidence of poverty in Wad Banda locality for total income was 35%.
Poverty gap and poverty severity were 26% and 11% respectively regarding consumption on food only (C1). Teabin (2010) mentioned that poverty gap and poverty severity for Wad Banda locality were 20% and 8% respectively with regards to (C1). As far as poverty gap and severity for total consumption (C2) is concerned, the study showed that poverty gap and severity were 18% and 7% respectively for total consumption which is relatively higher than Teabin (2010) results for Wad Banda locality which estimated them at 9% and 3% respectively.
Table (1). Consumption poverty indicators
| Poverty indicator | food consumption per adult equivalent (C1) | total consumption (food, clothes and education) (C2) |
| Head count | 74 | 62 |
| Poverty Gap | 26 | 18 |
| Poverty Severity | 11 | 7 |
| Geni | 0.25 | 0.25 |
Source: Field survey, 2013.
Table (2). Household monthly consumption
| Items | Average of monthly household consumption (SDG) | Percentage of monthly household consumption (SDG) |
| Food | 715.20 | 0.84 |
| Cloth | 40.02 | 0.05 |
| Education | 63.52 | 0.07 |
| Health | 29.83 | 0.04 |
| Total | 848.57 | 1.00 |
Source: Field survey, 2013.
Table (3). Daily consumption per adult and equivalent
| Items | Average of daily consumption per adult equivalent (SDG) | Percentage of daily consumption per adult equivalent (SDG) |
| Food | 5.10 | 0.84 |
| Cloth | 0.31 | 0.05 |
| Education | 0.40 | 0.07 |
| Health | 0.22 | 0.04 |
| total | 6.04 | 1.00 |
Source: Field survey, 2013.
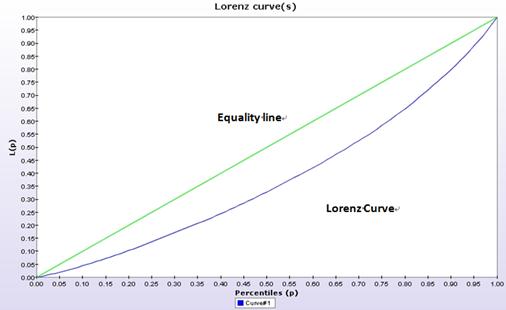
Source: Field survey, 2013.
Figure (2). Consumption Lorenz Curve
The findings of the study showed that expenditure on food represented 84 % of total consumption which also relatively higher than Teabin (2010) results which estimated the percentage of consumption on food at 76% of total consumption of households studied, while clothes represented 5% of total consumption which is identical with Teabin (2010) results of Wad Banda locality which estimated cloth consumption also at 5%. Furthermore the study estimated the percentages of consumption on education and health at 7% and 5% respectively.
The study revealed that the average of monthly total household consumption estimated at 849 SDG (142 USD), segregated to 715 SDG (119 USD) for food, 40 SDG (7 USD) for clothing, 64 SDG (11 USD) for education, and 30 SDG (5 USD) for health table (2).
Regarding daily consumption per adult equivalent, the study declared that, the average of total daily income per adult equivalent was estimated at 6.04 SDG (1 USD) which typically is equal to poverty line, where the average of daily consumption on food only per adult equivalent is estimated at 5.10 SDG (0.85 USD) (84%), 0.31 SDG (0.05 $) (5%) for clothes, 0.40 (0.07 $) (7%) for education, and 0.22 SDG (0.04 $) (4%) for health.
5. Gini Coefficient and Inequality
Results of the study revealed that inequality was higher in income distribution than consumption distribution as indicated by Lorenz curve and Gini coefficient, figure (2). Consumption Gini coefficient was 0.25 while income Gini coefficient was 0.43.
6. Causes of Poverty
High poverty rates exited in the area as result of many interrelated natural and social factors. When participants in group discussion were asked to name causes of poverty in the area, they mentioned many factors. Rain variability was the main cause of livelihood vulnerability. Agricultural pest and diseases, traditional farming methods, marketing problems, low income, low capabilities, lack of finance, shortages of formal jobs, low level of social services (education, health, water) are considered some of the factors that lead to poverty beside many other social factors.
Ajakaiye and Adeyeye (2002) stated that there is no one cause or determinant of poverty. On the contrary, combinations of several complex factors contribute to poverty. These include low or negative economic growth, inappropriate macroeconomic policies, deficiencies in the labor markets resulting in limited job growth, low productivity and low wages in the informal sector, and a lag in human resource development. Other factors which have contributed to a decline in living standards are structural causes or determinants of poverty include increase in crime and violence, environmental degradation, public retrenchment, a fall in the real value of safety nets, and changes in family structures. All or some of these factors came up in group discussions in the study area.
References
- Ajakaiye D. O. and Adeyeye V. A. (2002), Concepts, Measurement and causes of povrty. CBN Economic & Financial Review, Nigeria. 20-26.
- FAO. Impacts of Policies on Poverty: The Definition of Poverty. Rome, 2005, 1-5.
- Haughton Jonathan, and Khandker Shahidur R. (2009). Handbook on Poverty and Inequality. The International Bank for Reconstruction and Development, World Bank.
- IFAD (2007). Enabling the rural poor to overcome poverty in Sudan. Via del Serafico, 107 – 00142 Rome, Italy.
- Taha Mohyel Deen El Toahmi (2007). Land Degradation and conflict in Sudan paper. University of Juba.
- Teabin Mohammed Abdalla (2010), Assessment of poverty rates in Sudan, A case study of Wadbanda Locality, North Kordofan state. Sudan University of Science and Technology.
- UNDP (2006), MacroeconomicPolicies for Poverty Reduction: The Case of Sudan. House 7, Block 5, Avenue P.O. Box: 913 Khartoum, Sudan, United Nations Development Programme in Sudan.
- UNICEF (2000). Poverty Reduction Begins with Children. New York.
- World Bank (2005). Poverty manual.
- World Bank (2003). Poverty Measurement and Analysis. Technical Notes, 405-407. siteresources.worldbank.org/INTPRS1/Resources/.../5808_annex_a.pdf
- World Bank, FAO, and IFAD (2009), Gender in Agriculture sourcebook.1818 H Street, NW Washington, DC 20433, The International Bank for Reconstruction and Development.


