
International Journal of Life Science and Engineering, Vol. 1, No. 4, September 2015 Publish Date: Jul. 9, 2015 Pages: 150-164
Using MODIS- Derived NDVI and SAVI to Distinguish Between Different Rangeland Sites According to Soil Types in Semi-Arid Areas of Sudan (North Kordofan State)
Nancy Ibrahim Abdalla1, Abdelaziz Karamalla Gaiballa1, Christoph Kätsch2, Mahgoub Sulieman1, Abdalbasit Mariod3, 4, *
1Sudan University of Science and Technology, College of Forestry& Range Science, Khartoum, Sudan
2Georg-August University, Faculty of Resource Management, Gottingen, Germany
3College of Science & Arts, University of Jeddah, Alkamil, KSA
4Sudan University of Science and Technology, College of Agricultural Studies, Khartoum North, Sudan
Abstract
This study was conducted to investigate the use of remote sensing data to distinguish between different rangeland sites. Three rangeland sites were selected based on soil types and variation in vegetation cover. Normalized Difference Vegetation Index and The soil-adjusted vegetation index were used. All selected rangeland sites exhibited NDVI and SAVI. Results showed that there were a number of important implications regarding using NDVI and SAVI. The results revealed that, the characteristics and different types of soils characterize different rangeland land sites as basic units for assessing special change when monitoring rangelands in semi-arid areas. Therefore, for better differentiation capacity we need to increase our understanding of vegetation structure and soil type in each range site.
Keywords
Semiarid Areas, Natural Rangeland, Soil Types, Remote Sensing, MODIS, Time-Series, NDVI, SAVI
Received:May 1, 2015
Accepted: May 27, 2015
Published online: July 7, 2015
@ 2015 The Authors. Published by American Institute of Science. This Open Access article is under the CC BY-NC license. http://creativecommons.org/licenses/by-nc/4.0/
1. Introduction
Arid and semi-arid areas are characterized by low and erratic rainfall of up to 700mm per annum, with periodic droughts and diverse affiliations of vegetative cover and soils. Therefore, these ecosystems are susceptible to rapid land cover change by numerous variables, for example, low rainfall, overstocking, improper agricultural practices, seasonal fire outbreaks, frequent droughts, wind and water erosion (Darag and Yousif, 1996). North Kordofan State lies within this area which is characterized by a fragile ecosystem and considered as a major rangeland resource in Sudan. Accurate field estimation of vegetation cover and biomass is essential for any improvements in rangeland vegetation modelling and monitoring. It is very arguable on the accuracy and correctness of some present traditional rangelands measurements and monitoring techniques due to the common constraints of available time and fund and it requires resources that may not be accessible at all times.
Characterization and identification of range sites require the use of soil survey maps, soil series descriptions, soil map unit descriptions, range site descriptions, and field information for specific sites (Manske, 2002). At the same time, there is difficulty in gathering this data as a result of the vast spaces and high cost of inventory particularly under Sudan conditions. Subsequently, to keep up the rangeland in a productive condition, a land manager must have the capacity to describe rangeland conditions and observing their change over time. Remote sensing technology is perceived as a good tool for rangeland management given that it is fit for giving multi-temporal and times series information on the condition of the vegetation.
Remote sensing data represent the best information for monitoring vegetation and mapping of land degradation and it has significant promise for development of more dependable and economically feasible measures of vegetation production over large areas. Consequently, it assumes an essential part in rangeland monitoring and assessment which are often difficult to access, and the cost of ground monitoring is expense. Revees et al (2001) stated that using MODIS data, it will be possible to characterize rangeland vegetation seasonality, estimate herbage quantity and, monitor the rates and trends of change in primary production. Reliable, objective and frequent productivity estimates will be accessible for even the most difficult to reach rangelands. This study was designed to investigate the use of remote sensing data that could help to secure information and data which are more efficient and effective to distinguish between different rangeland sites based on soil types for monitoring and management purposes.

Figure (1). Location map of the Sudan with study area.
Table (1). Characteristics of the three selected sites (North Kordofan State).
| Study sites | Location | Vegetation | Soil type % | ||
| Clay | Silt | Sand | |||
| Jebel Kordofan (Gardud) | 15 Km East of Elobied city | Grassland | 16 | 6 | 82 |
| Um Glugi (Sand sheet) | North of Elobied city | Grassland/shrubs | 4 | 2 | 95 |
| Demokeya (Sand dune) | 40 Km North East of Elobied city | Grassland/shrubs | 6 | 4 | 90 |
2. Materials and Methods
2.1. Study Area
The study was carried out in the North Kordofan state which is located in western Sudan between latitudes 11° 20' to 16° 36' N and longitudes 27° 13' to 32° 24' E within arid and semi-arid zones (Fig 1). The study area was characterized by the diversity of environments and climate. It has an average annual rainfall of about 250 mm and it is characterized by great annual and seasonal variation in the amount and distribution. It has diverse vegetation resulting from the variability in soils and rainfall. Soils in the State range from sandy in the north to dark non-cracking clay soil in the south. The sandy soils cover an area of about 60% of the cultivable area, while the Gardud1occupies 30% and clay soils cover only 10%. The grazing resources are composed of a number of grasses and browse species in addition to crop residues.
Three rangeland sites were selected in the study area (Jebel Kordofan, Um Gulgi and Demokeya). These sites selected based on soil type and vegetation characteristics. The soil of the first site is loamy sand soil and the second and the third types are mainly sandy soil but with different topographical feature.
2.2. Remote Sensing Data
2.2.1. Vegetation Indices Used
Vegetation indices used in this study included Normalized Difference Vegetation Index (NDVI) and the Soil-Adjusted Vegetation Index (SAVI) images created from the MODIS TERRA surface reflectance. The NDVI was used to assess, monitor, and compare landscapes and it can be used to understand the various characteristics of vegetation community. It was chosen by Cummins (2009) to assess the spatial pattern of vegetation in semiarid rangelands of northern Spain relative to land use and land tenure. Wesis et al (2004) concluded that NDVI is an appropriate tool for describing the vegetation variability in arid and semi-arid regions and allows long time-scale investigations of vegetation conduct because of climate variability. The NDVI is a normalized difference measure comparing the near infrared (NIR) and visible red bands using the formula:
NDVI = NIR-Red / NIR+Red
Where NIR (841-876 NM) and red (620-670 NM) are the surface reflectance for the respective MODIS bands. NDVI values usually range from -1 to +1. Because of high reflectance in the NIR portion of the electromagnetic spectrum, healthy vegetation is represented by high NDVI values between 0.05 and 1.
Soil background has interfered with the light reflection in the application of vegetation indices and to adjust for soil background a soil-adjusted vegetative index (SAVI) was described by Huete (1988). The SAVI is based on the idea that, depending on the vegetation cover, the NDVI for different cover conditions does not converge at the same location. Therefore an L-factor is used to adjust the NDVI so that different vegetation densities will intersect the soil line at the same location. The soil adjusted vegetation index (SAVI) was defined as:
SAVI = (NIR-R) /NIR+R+L) * (1+L)
Where NIR stands for near-infrared, R stands for red and L is an adjustable parameter and typically 0.5. The resulting SAVI image, calculated using MODIS images, had a range of -1 to +1 real data (Jensen, 1996).
2.2.2. Data Source and Analysis
MODIS-TERRA 8 day 250- meter atmospheric corrected reflectance products (MOD09Q1) and 500- meter products (MOD09A1) were obtained from Land Processing Distributed Active Archive Centre (LPDAAC)for the purpose of this research. The MODIS product is Sinusoidal projection with the WGS84 datum. The images are available for a time series of 2005 to 2011in February, April and October. Site of the research within the study area (Jebel Kordofan, Um Gulgi and Demokeya) and sample plots were located with the help of Global Positioning System (GPS). The images were composites generally located in the middle of each month. These images were processed and subset to produce NDVI and SAVI times series for each site and produced as new images. The NDVI and SAVI were calculated for the selected rangeland sites from 2005-2011 to investigate annual variations of vegetation indices during growing season and during dry years (where grasses disappeared while trees are still green). Spectral responses were examined for three sites to distinguish between rangeland sites in the dry season using the mean values of NDVI and SAVI. The ERDAS imagine image processing package was used to obtain the values of NDVI and SAVI then the mean of NDVI and SAVI were obtained for each site interval by time to assess changes in rangeland biomass between different range sites.
3. Results and Discussion
3.1. Seasonal Changes in NDVI and SAVI
The seasonal pattern in vegetation indices (NDVI and SAVI) is used in this study in order to examine their changes throughout the year and especially during the rainy season. Time series of NDVI and SAVI values of the gardud site during rainy season from 2005 to 2011 are presented in Fig (2). This site showed the largest values in SAVI response compared to NDVI. The lower values of NDVI reflect the effect of soil backgrounds. Huete and Jackson (1987) found that the soil-type had the greatest effect on NDVI values between 40 and75% vegetative cover. Several studies (Cakiret al, 2006) have shown that NDVI techniques produce limited discriminating abilities in areas less dominated by vegetative ground cover types. The higher SAVI values at gardud site might be due to the existence of some grasses patches and shrubs, Vegetation of arid and semi-arid rangelands often appear patchy with many herbaceous species associated with shrub species. Ghaemi et al (2012) pointed that radiation reflection varies with soil properties and other soil factors depending on vegetation cover density; therefore, estimation of vegetation cover based on remote sensing data is very complicated. There are similar features in terms of the general response of the NDVI and SAVI during the rainy season for seven years from (2005-2011) in the sand sheet and sand dune sites (Figures3 and 4). Generally, the results showed relatively high values of NDVI compared to SAVI values time series. High NDVI values are an indication of high photosynthetic activity and biomass accumulation during the rainy season.
The seasonal changes in the NDVI values over time can be interpreted as a measure of changing vegetation dynamics over that time and differences in rainfall, The results clearly confirmed that the NDVI response to rainfall are generally controlled by soil types. Elhag and Walker (2008) also reported comparable results where they observed that there is a solid relationship between the peak NDVI and cumulative rainfall, because vegetation as part of the ecosystem is very sensitive to climate variability. However, both the growing season and the total amount of vegetation are strongly affected by climatic variability.
The ability of any remote sensing index to estimate biomass depends upon the reflectance characteristics of both the vegetation and the soil background. The variability in the NDVI and SAVI values of the three selected range sites for the 2005-2011 during the rainy season (October month) is shown in Fig (5). There are general trends in changes among sites. The highest NDVI values were reported for the sand sheet and sand dune sites. This can be attributed to the dense vegetation cover (both range and woody species). The differences from site to site are due to differencing amounts of vegetation, soil types and land use pattern. The results expressed the fact that sand sheet and sand dune sites were not affected by soil background, then when soil reflectance was low, the sensitivity of NDVI decreased. The lower values of NDVI for the gardud site could be also due to spectral influences of bare soil and decreasing soil moisture may also moderately produce this low NDVI values. These results confirmed the findings of previous studies (Chahouket al, 2012) indicated that the spatial distribution of plant species and communities over a small geographic area in desert ecosystems is related to heterogeneous topography and landform pattern. The high and low value of NDVI over time in the three rangeland sites is characteristics of vegetation growth and is therefore taken as an indication of the occurrence of vegetation. Verhulst et al, (2009) stated that vegetation type, phonology, and distribution, as well as soil type, climatic conditions, and land use are all factors that affect NDVI values.
The SAVI values for different range sites investigated are shown in figure (6). The Gardud site recorded the highest SAVI values compared to other range sites. This result was attributed mainly to the effects of soil background, because reflectance properties are produced by the patchy distribution of soil types and vegetation communities. Ahmed (2012) stated that the soil background is a main surface factor controlling the spectral behavior of vegetation canopies and on which there trieval of biophysical characteristics of the canopy depends.
Peng and Jian-fei (2008) stated that NDVI images generally reflect land cover as a whole, and are able to distinguish quantitatively the vegetation from other, they are fit for investigation of a great area. SAVI images (Fig, 5to 15) give much importance to the information of internal difference of the vegetation as they expand the extracted spatial information of the vegetation to a certain extent, so they can provide major references for the information extraction of different vegetation type.
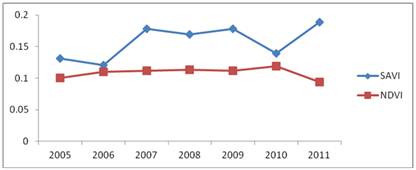
Figure (2). Shows NDVI and SAVI values time series (2005-2011) in the gardud site.
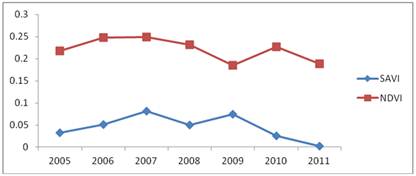
Figure (3). Shows NDVI and SAVI values time series (2005-2011) in the sand sheet site.
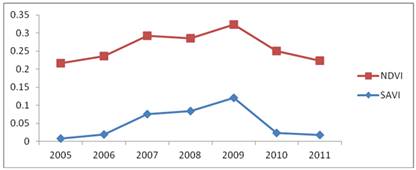
Figure (4). Shows NDVI and SAVI values time series (2005-2011) in the sand dune site.

Figure (5). Shows Comparison of averages time – series NDVI profiles of selected sites. Profiles represent average NDVI values (using mean site pixel values) for 2005-2011.

Figure (6). Shows Comparison of averages time – series SAVI profiles of selected sites. Profiles represent average SAVI values (using mean site pixel values) for 2005-2011.

Figure (7). Shows NDVI time – series profiles of three selected range sites for the dry season of 2005-2011. NDVI values represent mean pixel values within each site.
Figure (8). Shows spectral reflectance time – series profiles of three selected range sites for the dry season of 2005-2011. Spectral reflectance values represent mean pixel values within each site.

Figure (9). NDVI and SAVI derived from 2005 MODIS image in the selected rangeland sites.

Figure (10). NDVI and SAVI derived from 2006 MODIS image in the selected rangeland sites.

Figure (11). NDVI and SAVI derived from 2007 MODIS image in the selected rangeland sites.

Figure (12). NDVI and SAVI derived from 2008 MODIS image in the selected rangeland sites.

Figure (13). NDVI and SAVI derived from 2009 MODIS image in the selected rangeland sites.

Figure (14). NDVI and SAVI derived from 2010 MODIS image in the selected rangeland sites.

Figure (15). NDVI and SAVI derived from 2011 MODIS image in the selected rangeland sites.
3.2. Changes in NDVI Time Series During Dry Season
Average NDVI values for the dry period (February month) were calculated for each range site in each year. The NDVIvalues of the sand site, generally reflects woody cover (Fig 7). However, the greater NDVI values of the sand site curve are indicating the existence of trees in this site. In the other sites there are some trees and shrubs, these seem to have little influence on the NDVI. Differences in NDVI values between different rangeland sites may be attributed to differences in cover which represented variation in density and size of plant in each site. Due to the differences in the environmental conditions there were differences in the woody density between sites. This result support those of Aguilar et al (2012) they found that NDVI of woody vegetation can be used as an indicator of ground water availability and precipitation inputs.
3.3. Soil Spectral Reflectance Variations
The spectral reflectance values for soil using band seven of MODIS imagery is shown in Fig (8) and their mean values were calculated for the three selected rangeland sites from 2005 to 2011 during dry seasons mainly April. The results indicated that the gardud site showed lowest spectral response compared with the other sites and it is clear that it could be distinguished using this band with MODIS images. This may be due to the fact that this site appears black (dark) on the top surface. Therefore, the low reflectance value is due to this black, which absorbs a large amount of the incident light. In contrast, bright soils exhibit low reflectance values. The bright soils are found on the other sites (sand sheet and sand dune sites), where soil sand content is high and surface moisture is quite low.
Variations in spectral values that could be measured for the three-rangeland sites primarily related to soil properties, because the soil has a particular spectral signature that differentiates it from other land cover types. This result in agreement with Post et al., (1994) stated that the surface reflectance value of a soil is related to a number of factors, physical and chemical properties of the soil, and to the condition of the surface. Frederiksen (1993) also pointed that different soil types have different spectral characteristics, and thus the uncovered soils contribute differently to the spectral signature according to soil type.
4. Conclusion
The use of the MODIS- derived NDVI and SAVI showed differences among sites and it can be used to detect differences in the reflectance patterns between the soil background and the vegetation. According to results, it has been observed that all sites exhibit high NDVI values except gardud site, which showed high SAVI values. This is attributed to the pattern of plant growth, while the variation between sites is attributed to the differences of soil characteristics as linked to its influence on vegetation type. The results also investigated that the greater values of NDVI in the dry season on the sand site are attributed to the higher density of trees. It has also shown that the use of MODIS band 7 has enabled to distinguish gardud site from other sites (Sand sheet and/or Sand dune sites) mainly due to remarkable differences in the soil characteristics. The observations we collected from this study confirmed that these indices can be used to distinguish between different rangeland sites having different characteristics based on soil types. This could be used for assessing and monitoring rangeland in semi-arid areas of Sudan.
References
- Aguilara, C. Julie C. Z. María, J. Donald, R. Young. (2012). NDVI as an indicator for changes in water availability to woody vegetation Cristina.Ecological Indicators 23 (2012) 290–300.
- Ahmad, F. (2012). Spectral vegetation indices performance evaluated for Cholistan Desert. Journal of Geography and Regional Planning.Vol. 5 (6),pp. 165-172.
- Cakir, H. I. Khorram, S. Nelson, S. A. (2006). Correspondence analysis for detecting land covers change. Remote Sensing of Environment 102: 306-317.
- Chahouk, M.A. Khalasi, L and Azarnivand, H. (2012). Environmental Factors Effects on Distribution of Vegetation Types in Dary an Rangelands of Iran International Conference on Chemical, Environmental and Biological Sciences (ICCEBS) Penang, Malaysia.
- Cummins, B. (2009). Bear Country: Predation, Politics, and the Changing Face of Pyrenean Pastoralism. Carolina Academic Press, Durham, North Carolina. 355 pp.
- Darag, A. and Yousif, E. (1996). The savannah Rangeland of the Sudan. In Dryland Husbandry in the Sudan. Workshop Report. OSSREA, DHPpublications Series, edited by tegegne Teka.no.1:24-45 Addis Ababa.
- Elhag, M. and Walker, S. (2008). Impact of Climate change and the Human Activities on land degradation in Arid and Semi-arid Region. The3rd International Conference on Water Resources and Arid Environments and the 1st Arab Water Forum.
- Frederiksen, P. (1993). Satellite based assessment and monitoring of land degradation in semi arid tropical Africa- aspect of soil/vegetation complex.Earsel advances in remote sensing. Vol.2, N 0.3-X1.
- Ghaemi, M. Sanaeinejad S. H. and Astaraei, A. (2012). Vegetation Cover Assessment Based on Soil Properties in Arid and Semi-arid Areas using Landsat Images: A Case Study in Neyshaboor Area. Asian Journal of Plant Sciences, 11: 9-18.
- Huete, A. R., and Jackson, R. D. (1987). Suitability of spectral indices for evaluating vegetation characteristics on arid rangelands, Remote Sensing of Environ.,25:89-105.
- Huete, A.R. A soil-adjusted vegetation index (SAVI). Remote Sens. Environ. 1988, 25, 295-309.
- Jensen, J. R. (1996). Introductory Digital Image Processing: A Remote Sensing Perspective, 2nd edition, Prentice Hall,New Jersey.
- Manske, L. (2002). Grassland ecosystem monitoring: A nonquantitative procedure for assessing rangeland performance status, Annual Report.Dickinson Research Extension Center.
- Post, D. F., E. H. Horvath, W. M. Lucas, S. A. White, M. J. Ehasz, and A. K. Batchily. 1994. Relationship between soil color and Landsat reectance on semiarid rangelands. Soil Science Society of America Journal 58:1809±1826.
- Peng, Q and Jian-fei, CH. (2008). A Comparison between NDVI and SAVI for Vegetation Spatial Information Retrieval Based on ASTER Images: A Case Study of Huadu District, Guangzhou (School of Geographical Sciences, Guangzhou University, Guangzhou 510006,China) tropical geography.
- Revees, M. C. Winslow, J. C. and Running, S. W (2001). Mapping weekly rangeland vegetation productivity using MODIS Algorithm. Journal 54:90-150.
- Verhulst, N., Govaerts, B., Sayre, K. D., Deckers, J., François, I. M., and Dendooven, L.(2009). Using NDVI and soil quality analysis to assess influence of agronomic management on within-plot spatial variability and factors limiting production. Plant Soil, 317: 41–59.
- Weiss, J. L. Gutlzer, D. S. Coonrod, A and Dahm, N. C. (2004). Long term Vegetation Monitoring with NDVI in a Diverse Semi-arid Setting,Central New Mexico, USA. Journal of Arid Environments, 58:248-271.
Footnotes
1Gardud is soil with compact and hard top layer characterized by low Water infiltration


