
International Journal of Life Science and Engineering, Vol. 1, No. 2, May 2015 Publish Date: Apr. 10, 2015 Pages: 39-44
Analysing Electronic Service Quality from Customer Point of View in Telecommunications Company of Esfahan
Samira Rahmani-Moghadam1, *, Majid Rashid-Kaboly2
1Department of Management, Najaf Abad Branch, Islamic Azad University, Najaf Abad, Isfahan, Iran
2Management Department, Esfahan University, Esfahan, Iran
Abstract
If you want to take maximum advantage of electronic services in the field of information and communication technologies in the pioneering countries in world class, be sure of various applications of information and communication technologies in the best use. Planning for the deployment of these applications will not be effective without them. Evaluate the quality of electronic services and customer satisfaction is one of the strategies that have allowed us to provide the quality of various applications of information and communication technologies such as commerce, e-government, e-services, telecommunication, electronic education and awareness.... and use this feedback to improve the work In this paper, after reviewing the literature on service quality and satisfaction with e-mail clients EUCS model is chosen as a model of study is described, and then use these models to assess the quality of a telecommunications company. The research method used is descriptive research. The research population consisted of all clients Esfahan is a telecommunications company that services the company will use a sample size of 332 patients was determined using the formula and simple random sampling method with reference to the telecommunications company clients of Esfahan was carried out. To assess the quality of the original five variables of ease of use, time savings, service content, appearance and accuracy hypothesis was formed from the consumer's perspective Telecom The sixth hypothesis is related to the overall satisfaction of customers is a telecommunications company. To evaluate the quality of questions with the help of a supervisor and collect relevant data other research model was developed containing 36 questions. The results of this study indicate that the index is easy to use, time saving, service content, appearance and accuracy of the electronic service quality evaluation, higher than average by end-customers was also evaluated. The 95% level meaningful relationship between gender, age and education indicators of EUCS (ease of use, time savings, service content, appearance and accuracy) was observed.
Keywords
Services-Electronic Services, Quality, E-satisfaction Model EUCS, Customer
Received: March 21, 2015
Accepted: April 5, 2015
Published online: April 10, 2015
@ 2015 The Authors. Published by American Institute of Science. This Open Access article is under the CC BY-NC license. http://creativecommons.org/licenses/by-nc/4.0/
Contents
1. Introduction 2. Literature Review 2.1. E-satisfaction 2.2. Electronics- Satisfactions Models 2.3. End-User Computing Satisfaction (EUCS) Method 2.4. Hypotheses 3. Research Methodology 3.1. Type of Study 3.2. Sampling Method and Sample Size 3.3. Validity of Questionnaire 3.4. Reliability of Questionnaire 4. Conclusions
1. Introduction
Developed countries know benefits of the service sector more than other sectors and focus their activities in these sectors. Increasing the number of services jobs accomplishing by increasing the importance of these types of industries in GDP, Subject impeccable service and superior quality to the important issue. There is no doubt that all organizations are looking for achieving high quality, but it is more important for services organizations. Concepts of service quality and service satisfaction has been attended in the documents and marketing activities during the past decade. The marketing analyzers have admitted the satisfaction and quality advantages and introducing them as indicators of competitive advantage for organizations. On the other hand, loyalty is known as the most important structures in marketing services because of its ultimate effect on customer repurchase. In fact, loyal customers who buy frequently are considered as the foundation of work.
The first step to improve service quality is to identify weaknesses and shortcomings of provided services and the strengths of the services. The strengths and weaknesses of the provided services can be measured using service quality tools. One of these tools is EUCS model. EUCS model is widely used in various parts of the services sectors for measuring the quality of electronic services. Hence, in this study the service quality of Telecommunications Company is measured via e-customer satisfaction EUCS model in Esfahan city.
2. Literature Review
Karimi et al. (2011) assesses banks services quality through revised SERVPERF model. In order to assessing quality five main variables was used (including tangibles, human factors, main services, systematization of services, and social responsibility). The results of this study indicates that services quality in these branches (based on all of factors) is more than moderate level based on revised SERVPERF model from customer’s perspective. Mohsin Muhammad Butt (2010) in his study seeks to envelope and exam the SERVQUAL model scale for measuring Malaysian private health service quality. Results indicate a moderate negative quality gap for overall Malaysian private healthcare service quality and also indicate a moderate negative quality gap on each service quality scale dimension.
Firdaus Abdullah et al. (2011) aims to formulate and confirm a new measuring instrument of service quality, and ultimately to establish a national service quality index for the banking sector. The questionnaires were distributed to the customers of Islamic banks, of which 1,519 were deemed usable. A factorial analysis mentions that service quality has three dimensions namely "Systemization", "Reliable Communication" and "Responsiveness", and subsequent multiple regression analysis revealed that "Systemization" is the most important service quality dimension within the banking sector.
Norizan and Nor Asiah (2010) in their study for testing the dimensionality of the perceived service quality show that perceived service quality was found to have a significant impact on customer satisfaction. In turn customer satisfaction was found to have a significant effect on trust. Both customer satisfaction and trust have significant effects on loyalty through word of mouth (WOM) while WOM is an antecedent of repeat visits or repurchase intentions. Interestingly, trust does not directly influence the latter. With the exception of the effect of satisfaction on trust, we found no significant difference between the effects of perceived service quality on satisfaction, satisfaction on loyalty, and trust on loyalty among the Qatari and Malaysian customers indicating that the relationships in the model did not hold across the two cultural groups because the respondents have similar cultural background.
Salih Turan et al. (2012) the purpose of this study is to investigate how international students perceive travel agency services by using the SERVQUAL instrument. Research results reveal that the expectations of university students are not met and that the largest gap was found in the "empathy" dimension and overall satisfaction of all students has a positive and statistically significant impact on their word of mouth.
Chien-Chang et al. (2011) in his study attempts to fill the gap in the literature off service quality by establishing a fuzzy weighted SERVQUAL model for evaluating the airline service quality. By choosing the case study of Taiwanese airline this study conducted to demonstrate the effectiveness of the fuzzy weighted SERVQUAL model and some useful suggestions are given to airlines to improve the service quality.
2.1. E-satisfaction
Various definitions of e-satisfaction are proposed that some of them are mentioned here:
Electronics satisfaction means a customer satisfaction according to his or her previous experience of shopping from an electronic business company (Tylor, 1995). Electronic customer satisfaction is the satisfaction rate of web design, information content, security, convenience shopping and purchasing (Oliver, 1989). Electronics satisfaction means preferring goods or services from a firm rather than other competitors (Oliver, 1999).
Electronics satisfaction is the customer satisfaction rate of support for sending and receiving orders of goods or services, after sales service, the price of goods or services, the quality of the website content, website speed, website reliability, ease of use of the website, Online financial security and personal privacy (Lee, 2001).
2.2. Electronics- Satisfactions Models
In follow some of the Electronics- satisfactions models are introduce:
Hays and Seazmanskay in 2000 show a very interesting model that introduced e-satisfaction dimensions as follows: ease of purchase, the product figures, web site design, and financial security.
In 2001, Lee & Toorben consider these effective dimensions on electronic satisfaction: support for sending and receiving orders, customer service, pricing, site speed, and quality of content, ease of use, financial security and personal privacy.
Milz (2002) assess the electronic satisfaction among 174 students in university. He finds the following factors influence on electronic satisfaction: electronic interaction with the web site, the perceived quality of Web services, and the perceived value of Web client.
Baer and Garter in 2002 with research on the determinants of Internet, and e satisfying introduce these determinants: access to information, Structure Details, Personalize, Integration and Information Exchange.
2.3. End-User Computing Satisfaction (EUCS) Method
End-User Computing Satisfaction model is known by some independent variables (ease of use, time savings, electronic service content, appearance and accuracy), we examined EUCS model is chosen for two main reasons. First of all, this model measures the objectives of the study that is evaluating the user satisfaction of services. Second, the EUCS models were reviewed and chosen from different studies. In a number of models satisfaction is only one component of a larger model; while, in the EUCS model satisfaction is the key variable. Finally, in 2001, Lee expected that if the sample size is small, the independent variables of the model should not be too much .so, after reviewing numerous models the EUCS model was selected as the appropriate model for this study (Figure 1).
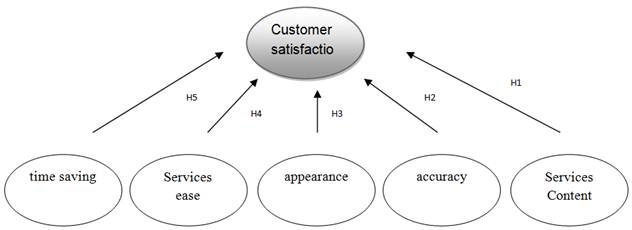
Figure 1. Model of Customer Satisfaction Electronic services (EUCS)
Table 1. Operational Definitions of Variables
| Services Content: the variety of provided information to customers through electronic telecommunications services |
| Accuracy of provided services: accurate information presented to the customer through electronic telecommunications services |
| Services appearance: clear and usefulness of provided information to customers through electronic telecommunications services |
| Services ease of use: the convenience and simplicity of using electronic communication systems |
| Time saving: get updated information whenever necessary, in the shortest possible time |
2.4. Hypotheses
1. The customers of Telecommunications Company of Esfahan evaluate time saving dimension of provided services in medium and high level.
2. The customers of Telecommunications Company of Esfahan evaluate Services Content dimension of provided services in medium and high level.
3. The customers of Telecommunications Company of Esfahan evaluate Services ease of use dimension of provided services in medium and high level.
4. The customers of Telecommunications Company of Esfahan evaluate Services appearance dimension of provided services in medium and high level.
5. The customers of Telecommunications Company of Esfahan evaluate integrity and accuracy of the service dimension of provided services in medium and high level.
6. The customers of Telecommunications Company of Esfahan evaluate overall quality of service dimension in medium and high level.
3. Research Methodology
3.1. Type of Study
This study is descriptive-survey from method perspective and practical in purpose perspective. The purpose of this study is to evaluate Electronic service quality of the telecommunications company in Esfahan via e-customer satisfaction using EUCS model which are selected through simple random way.
3.2. Sampling Method and Sample Size
In this study, following formula used to calculate sample size.
The sample size formula:
![]()
n= frequency of sample
S2= pre-estimation of variance
N= statistical sample size
D= 5%
t= 95%
In order to calculate final sample size, first 30 questionnaires distributed among all customers of Esfahan telecommunications company services, then variance of statistical population estimated 0.3 with respect to variance of statistical population and then final sample size calculated 332 with 95% confidence.
3.3. Validity of Questionnaire
Every question of the questionnaire was designed after its literature review. In order to examine validity of questionnaire, content validity and structural validity were used. In order to examine content validity, the questionnaire offered for supervisor and advisor and then their corrections and modifications were applied in the questionnaire and then final version of questionnaire was designed and indicated statistical sample. Therefore content validity of questionnaire was confirmed. Also convenience of answering questions confirms its structural validity. In order to direct the respondents to answer the questionnaire, studies’ purposes and some directions about method of answering questions offered in the first page.
3.4. Reliability of Questionnaire
In order to examine reliability of questionnaire, Crobach’s Alpha was used. Based on this method, first 30 primary questionnaires were distributed among customer and its Crobach’s Alpha calculated 0.96 for the questionnaire, this value is acceptable for verification.
Analysis of research hypotheses
First hypothesis Testing
The first hypothesis of this research is as below:
1- The customers of Telecommunications Company of Esfahan evaluate time saving dimension of provided services in medium and high level.
![]()
The results of inferential statistic indicated in table 2. Based on the results of this table, t is 30.158, df is 331, and significant level is 0.000. With respect to sig is 0.000 and is less than 0.05, therefore H0 rejected and H1 confirmed.
Table 2. Inferential statistics for H1
| H1 | Supposed average: 3 | ||||
| t | df | sig | Average difference | ||
| time saving | 30.158 | 331 | 0.000 | 1.06008 | |
Second hypothesis Testing
The second hypothesis of this research is as below:
2. The customers of Telecommunications Company of Esfahan evaluate Services Content dimension of provided services in medium and high level.
![]()
The results of inferential statistic indicated in table 3. Based on the results of this table, t is 18.531, df is 331, and significant level is 0.000. With respect to sig is 0.000 and is less than 0.05, therefore H0 rejected and H1 confirmed.
Table 3. Inferential statistics for H2
| H2 | Supposed average: 3 | ||||
| t | df | sig | Average difference | ||
| Examination of service content | 18.531 | 331 | 0.000 | 0.66559 | |
Third hypothesis Testing
The third hypothesis of this research is as below:
3. The customers of Telecommunications Company of Esfahan evaluate Services ease of use dimension of provided services in medium and high level.
![]()
The results of inferential statistic indicated in table 4. Based on the results of this table, t is 14.162, df is 331, and significant level is 0.000. With respect to sig is 0.000 and is less than 0.05, therefore H0 rejected and H1 confirmed.
Table 4. Inferential statistics for H1
| H3 | Supposed average: 3 | ||||
| T | df | sig | Average difference | ||
| Examination of ease of use | 18.531 | 331 | 0.000 | 0.66559 | |
Fourth hypothesis Testing
The fourth hypothesis of this research is as below:
4. The customers of Telecommunications Company of Esfahan evaluate Services appearance dimension of provided services in medium and high level.
![]()
The results of inferential statistic indicated in table 5. Based on the results of this table, t is 13.944, df is 331, and significant level is 0.000. With respect to sig is 0.000 and is less than 0.05, therefore H0 rejected and H1 confirmed.
Table 5. Inferential statistics for H4
| H4 | Supposed average: 3 | ||||
| T | df | sig | Average difference | ||
| Examination of appearance | 13.944 | 331 | 0.000 | 0.53501 | |
Fifth hypothesis Testing
The fifth hypothesis of this research is as below:
5. The customers of Telecommunications Company of Esfahan evaluate integrity and accuracy of the service dimension of provided services in medium and high level.
![]()
The results of inferential statistic indicated in table 6. Based on the results of this table, t is 19.725, df is 331, and significant level is 0.000. With respect to sig is 0.000 and is less than 0.05, therefore H0 rejected and H1 confirmed.
Table 6. inferential statistics for H5
| H5 | Supposed average: 3 | ||||
| T | df | sig | Average difference | ||
| Examination of accuracy | 19.725 | 331 | 0.000 | 0.67773 | |
Sixth hypothesis Testing
The sixth hypothesis of this research is as below:
6. The customers of Telecommunications Company of Esfahan evaluate overall quality of service dimension in medium and high level.
![]()
The results of inferential statistic indicated in table 7. Based on the results of this table, t is 20.047, df is 331, and significant level is 0.000. With respect to sig is 0.000 and is less than 0.05, therefore H0 rejected and H1 confirmed.
Table 7. Inferential statistics for H6
| H6 | Supposed average: 3 | ||||
| T | df | sig | Average difference | ||
| Examination of overall services quality | 20.047 | 331 | 0.000 | 0.9052 | |
4. Conclusions
Answers to the questions related to ease of use show more than 3 that means on average customers evaluate the ease of use of Service Quality in Telecom Companies above average. Answers to the questions related to time savings show more than 3 that means on average customers evaluate the time savings of Service in Telecom Companies above average. Answers to the questions related to content show more than 3 that means on average customers evaluate the content of Service in Telecom Companies above average. Answers to the questions related to the shape and appearance show more than 3 that means on average customers evaluate the shape and appearance of Service Quality in Telecom Companies above average. Answers to the questions related to accuracy show more than 3 that means on average customers evaluate the accuracy of Service Quality in Telecom Companies above average. In total, all of these factors on the quality of telecom services have above-average rating.
References
- Alves,A.Vieira , A(2006)," The SERVQUAL as a Marketing instrument to measure Services quality in Higher Education Institutions" Marketing Research and Techniques , Esce/ IPS , Campus do IPS , Estefanilha 2910 SETUBAl , Portugal .
- Ahire, L.S.etal .(1996)." Derbpment and Validation of TQM implementation Constracts", Decision Sciences .No. 27,pp.23-56.
- Arasli,H., Katircioglu, S.T. And Mehtab-smadi, S.,(2005),"A comparison of service quality in the banking industry:Some evidence from Turkish and Greek speaking areas in Cyprus", International Jornal pf bank Marketing,Vol.23,No.7,pp.508-526.
- Awasthiok & Dogra , Balram (2005) , " Measuring Service quality in banks : An assessment of Service quality dimentions ", Abstract Sumited to the Conference on Global competitiveness , Indian Indian Institute of Management kozhikode.
- Bartltt.E.Hames, (2007)," Analysis of Service quality in restaurants in China :An Eastern Perspective " , Proceeding of the ABR & Tlc Conference , university of South Carolina.
- Berkley , B. y. and Gupta, A.(1994) ," Improving Service guality with information technology", Internafinal yournal of Information Management , 14 , pp. 109-120.
- Boller ,G.W. and Babakus , E .(1992) ."An empirical assessment of the SERVQVAL Scale ", Journal of Business Research , Vol . 24 , No . 3, pp. 253-268
- Prayag,Girish.(2007) , " Assessing internal tourists , Perceptions of Service quality at Air- Mauritius", International.yournal of Qualit & Reliability Management , Vol. 24.No. 5,pp.492-514.
- Karimi, Hakimeh, Sanayei, Ali, Moshrefjavadi, Mohamadhosein , 2011, The study and Assessment of the Banking Service Quality in Isfahan Sepah Bank through Revised SERVPERF Model, Asian Journal of Business and Management Sciences, Vol. 2 No. 4 [09-22]
- Mohsin Muhammad Butt, Ernest Cyril de Run, (2010) "Private healthcare quality: applying a SERVQUAL model", International Journal of Health Care Quality Assurance, Vol. 23 Iss: 7, pp.658 – 673
- Firdaus Abdullah, Rosita Suhaimi, Gluma Saban, Jamil Hamali,(2011) "Bank Service Quality (BSQ) Index: An indicator of service performance", International Journal of Quality & Reliability Management, Vol. 28 Iss: 5, pp.542 – 555
- Norizan Kassim, Nor Asiah Abdullah,(2010) "The effect of perceived service quality dimensions on customer satisfaction, trust, and loyalty in e‐commerce settings: A cross cultural analysis", Asia Pacific Journal of Marketing and Logistics, Vol. 22 Iss: 3, pp.351 – 371
- Chien-Chang Chou, Li-Jen Liu, Sue-Fen Huang, Jeng-Ming Yih, Tzeu-Chen Han, 2011, An evaluation of airline service quality using the fuzzy weighted SERVQUAL method, Applied Soft Computing, The Impact of Soft Computing for the Progress of Artificial Intelligence, Volume 11, Issue 2, Pages 2117–2128
- Salih Turan Katircioglu, Salime Mehtap‐Smadi, Ceyhun Kilinç, Doğan Ünlücan,(2012) "Service quality and university students' satisfaction on the travel agencies: An empirical investigation from Northern Cyprus", International Journal of Quality and Service Sciences, Vol. 4 Iss: 3, pp.299 – 311


