
Bioscience and Bioengineering, Vol. 1, No. 3, August 2015 Publish Date: Jul. 9, 2015 Pages: 69-84
Wall Shear Stress Analysis Using Finite Volume Method for Blood Flow in Irregular Stenotic Arteries
Sina Pasha Zanous1, *, Rouzbeh Shafaghat1, Qadir Esmaeili2
1Department of Mechanical Engineering, Babol Noushirvani University of Technology, Babol, Iran
2Department of Mechanical Engineering, Ayatollah Amoli Branch, Islamic Azad University, Amol, Iran
Abstract
Blood flow through a stenosis artery may have different flow characteristics and produce different forces acting on the plaque surface and artery wall. The present study investigates the flow through the 55% (by area reduction) stenosed artery, both numerically and experimentally. First, the experimental study is carried out on a rigid asymmetric model of a stenosed artery. Afterward the flows are numerically simulated for the same flow rates, geometry, and fluid properties and to make sure the numerical results are reliable, the experimental and numerical pressure drop are compared. Finally, an ideal symmetric stenosed artery with same stenosed severely is numerically studied and the results of two numerical simulations are compared. The governing differential equations of blood flow are discretized using finite-volume method in the generalized body-fitted coordinates. In addition, an elliptic method for nearly orthogonal grid generation is presented in numerical study. The aim of this study is isolate the effect of actual stenosed geometry on the flow characteristics such as, wall shear stress (WSS), length of separation regions, swirl flow and maximum velocity distribution at different Reynolds numbers by comparing with ideal symmetric stenosis. It is pointed out that these probabilities are much higher for asymmetric model than symmetric one. Based on our results, high and oscillatory WSS values play a significant role in the destruction of endothelium. Furthermore, it is shown that WSS exceeds the critically reported value, 420 dyne/cm2, only at asymmetric model in maximum flow rate, that causes damage to the endothelium cell layer.
Keywords
Arterial Disease, Post-Stenotic, Computational Domains, Newtonian, General Curvilinear Coordinate, Wall Shear Stress
Received:May 4, 2015
Accepted: May 17, 2015
Published online: July 7, 2015
@ 2015 The Authors. Published by American Institute of Science. This Open Access article is under the CC BY-NC license. http://creativecommons.org/licenses/by-nc/4.0/
1. Introduction
In order to have a complete understanding of the development of the stenosis from the physiological point of view, one needs to be fully conversant with the hemodynamic behaviour of the streaming blood under physiological conditions. The ability to describe the flow through stenosed vessels would provide the possibility of diagnosing the disease in the earlier stages, even before the stenosis become clinically relevant, and is the basis for surgical intervention. Appropriate and timely intervention by cardiologists greatly reduces the risk of death. Mathematical modelling to predict flow through atherosclerotic arteries augment the percipience of cardiologists and assist understanding of the genesis and progression of stenosis development. Such techniques allow predicting the hemodynamic characteristics as pressure, shear stress, velocity and reduction in flow.
The initial investigation of blood flow through stenosed arteries carried out on experimental simulations and simple geometries or steady-state symmetrical simulations using numerical simulations. Steady flow through an axisymmetric stenosis is studied by Smith [1] using an analytical method. Numerical simulation of steady flow through an axisymmetric stenosis is carried out by Deshpande et al. [2], using a finite difference technique, and obtained flow patterns which are in good agreement with the experimental results of [3].
It is recognized that the wall shear stress (Tangential component of Forces exerted by the flowing blood on the endothelium) is the primary fluid mechanics properties that effect the biological arterial response [4]. Therefore, There already exist many experimental and computational studies that try to evaluate the fluid WSS on the plaque surface. Approaches based on human umbilical vein monolayers flourish that endothelial cells move from regions with high wall shear stress gradients and have increased proliferation rates. This kind of behaviour enhances the transport of low density lipoproteins or LDL into intima and initiates plaque precursors [5].
A study by Mittal et al. [6] provided an LES simulation on the planer channel with one-sided semi-circular constriction under pulsatile flow condition. They observed that Turbulence can have a dramatic influence on the wall shear stress downstream of the stenosis which can have a substantial negative influence on the cardiovascular system. For example, wall shear stresses and shear rates have been correlated with the incidence of atherosclerosis in the artery. The characteristics of pulsatile flow in the 3D blood vessel with symmetric stenosis are investigated by Jung et al. [7]and the effects of stenosis severity and wall shear stress are discussed. Analysis of the velocity and wall shear stress has shown that the high stress is exerted at the neck of stenosis due to the fast flow. Numerical study of non-Newtonian blood flow through an idealized bypass graft are carried out by Abraham et al. [8] and the influence of the inflow velocity, and thus the shear rate are studied to apply sensitivity-based optimization procedure to a flow through the arterial graft.
In a recent study by Zhang et al. [9], outlet boundary conditions are employed for the computational fluid dynamics simulation of human common carotid arteries bifurcation. They illustrated that numerical simulation based on the proposed boundary conditions gave an accurate prediction of the critical stenosis ratio of carotid arteries. Other boundary conditions, such as the constant external pressure, either overestimated or underestimated the critical stenosis ratio of carotid arteries.
It has long been assumed that low WSS and the related stagnation of blood permit increased uptake of atherogenic blood particles as a result of increased residence time [10]. More recent research has been illustrated that WSS can change the morphology and orientation of the endothelial cell layer. Endothelial cells subjected to elevated levels of WSS tend to elongate and align in the direction of flow, whereas those experiencing low WSS remain more rounded and have no preferred alignment pattern [11]. Generally, Results of vivo studies shows that both low wall shear stress and high oscillatory patterns of wall shear stress cause intimal wall thickening [12; 13; 14; 15].
Although extensive simulations on stenosis arteries have been conducted during past decades, the studies on the effects of asymmetric and irregular constriction on the WSS are still limited. The surface irregularities and the asymmetric shape of the constriction cause complexity in performing experimental and numerical simulations of the flow phenomena. In this study, a rigid clear plastic tube was deformed to create the asymmetric model in experimental part. It is also noted that, Wall shear stresses on artery walls have been difficult to acquire experimentally but have a strong link with the formation of arterial stenosis. This quantity requires accurate measurements about the artery wall, which is difficult, even for the technology presently available. It is therefore preferable to derive such parameters from numerically simulations. In the numerical simulation part, the geometric limitation is removed by adopting a general curvilinear coordinate system. To extract the exact geometry of the stenotic model which used in experimental setup, for numerical simulation, Computed Tomography (CT) scans of the stenosis model are obtained. Effects of stenosis on fluid dynamical characteristics for the blood flow are investigated numerically to quantify possible flow characteristics which may be related to artery fatigue and plaque cap rupture.
2. Experimental Details
The experiments were carried out in a closed-loop flow system. A schematic diagram of the flow apparatus is shown in Fig. 1. A rigid asymmetric model of a vessel was made by deforming a 25.4 mm diameter plastic tube. To ensure a fully developed laminar flow at the entrance of the model, the plastic tube was extended about 1 m upstream of the stenosis. Inlet Reynolds numbers (Re) of 130, 160, and 190 corresponding to the range of Reynolds number typically encountered in the human common iliac artery and 540 corresponding to the flow in the human renal artery are used. Flow in the human iliac and renal arteries are modelled, since they are the most common sites for development of atherosclerotic lesions. It is quite acceptable that the blood flow in a large vessel may be modelled accurately as a Newtonian fluid according to [16]. Therefore, Blood is modelled as a Newtonian fluid and the density is taken as constant throughout the domain in this study.
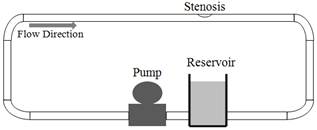
Fig. 1. Experimental setup.
Two pressure sensors were simultaneously used to measure the pressure upstream and downstream of the stenosis. The diameter of the sensor at the tip is ~1 mm. A data acquisition system was used to sample the pressure data at a rate of 100 samples per second. One of the pressure sensors was placed upstream of the stenosis and the other downstream. Fixing the location of the upstream sensor, the one downstream was moved further downstream to measure the differential pressure at different locations.
The sensitivity of the pressure sensor is 10 μV/V/ mmHg (0.8 Pascal). The pressure sensor measures the total pressure of the fluid. The total pressure includes both the static and dynamic pressures. The dynamic pressure is quadratically dependent on the velocity of the fluid particle adjacent to the tip of the sensor. Due to the gradient of the velocity profile in the stenosis model, the velocity varies significantly in a given cross-section. Therefore, to minimize the effects of the dynamic pressure on the measurements, the tip of the sensor was placed at the wall of the stenosis model.
To extract the exact geometry of the stenotic model for computational fluid dynamic simulations, Computed Tomography (CT) scans of the model were obtained. The exact geometry was measured with an in-plane and out-of-plane resolutions of 225 um/pixel and 625 um/pixel, respectively. A Matlab-based edge detection program was used to determine the periphery at each cross-section.
Fig. 2 shows a solid model of the present asymmetric stenosis model as well as an ideal symmetric model with the same cross-sectional area at the throat of the stenosis. The diameter of the arteries, D, is 25.4 mm and the domains extend to 4D and 17D upstream (Lu) and downstream (Ld) of the stenosis, respectively. Also, the length of the stenosis (Ls) is 1.5D in both models. A1 (a) and A1 (b) are cross-sections area at ![]() section for asymmetric and symmetric models respectively.
section for asymmetric and symmetric models respectively.
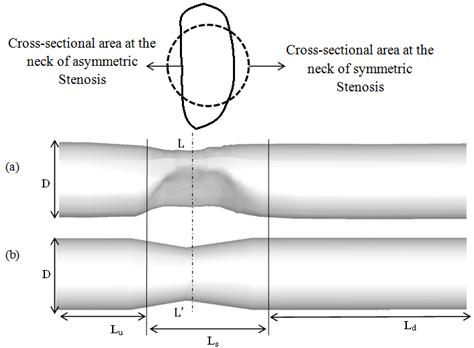
Fig. 2. Geometry of stenosis arteries (a) Asymmetric model (b) Ideal symmetric model.
The stenosis severity is calculated using:
S = (1-A1/A2) * 100 (2.1)
Where, A1 and A2 are the cross-sectional areas at the throat and inlet of both models, respectively.
3. Numerical Simulation
3.1. Computational Domain
The computation of flow fields in an around complex shapes involves computational boundaries that do not coincide with coordinate line in physical space. The use of generalized coordinate implies that a distorted region in physical space is mapped into a rectangular region in the generalized coordinate space.
3.2. Governing Equations
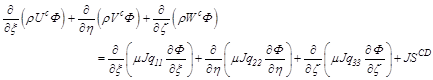
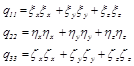
In this paper, a considerable effort is devoted to implementing three dimensional finite volume based finite difference method in generalized body fitted coordinate due to complex geometry of stenosis. We also assume that the fluid is homogeneous, Newtonian, incompressible, steady and laminar. Governing equations in general curvilinear coordinates can be written as follows [17]:
Continuity:
![]() (3.1)
(3.1)
Where![]() ,
,![]() and
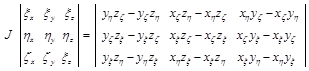
and ![]() are general curvilinear coordinates and determinant of inverse Jacobean is:
are general curvilinear coordinates and determinant of inverse Jacobean is:
![]() (3.2)
(3.2)
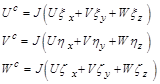
In addition, Uc, Vc and Wcthe components of the contravariant velocity, are:
 (3.3)
(3.3)
Momentum (Variable![]() is considering as a velocity components at Cartesian coordinates):
is considering as a velocity components at Cartesian coordinates):
 (3.4)
(3.4)
Where source term,![]() is evaluated by:
is evaluated by:
![]() (3.5)
(3.5)
Moreover, Coefficients![]() ,
,![]() and
and ![]() are:
are:
 (3.6)
(3.6)
Values![]() ,
,![]() and etc. are calculated from:
and etc. are calculated from:
 (3.7)
(3.7)
In this numerical practice, transformations parameters![]() ,
, ![]() etc. are evaluated numerically. It is note that the same means of discretization be used for the evaluation of the transformation parameters in governing equations. For this mean, central difference scheme is used in this study.
etc. are evaluated numerically. It is note that the same means of discretization be used for the evaluation of the transformation parameters in governing equations. For this mean, central difference scheme is used in this study.
3.3. Boundary Conditions
For the inlet boundary condition, parabolic velocity distribution is assumed (fully developed steady inlet flow) as follow:
![]() (3.8)
(3.8)
Where Umean is inlet mean velocity and D is diameter of inlet cross-section.
This model also assumes a convective boundary condition at the outlet of the domain:
![]() (3.9)
(3.9)
Furthermore, all the arterial walls are considered to be no-slip.
4. Grid Generation
Grid generation techniques by using generalized coordinate system have been widely used in the numerical solution of partial differential equations on arbitrary-shaped regions. Generally, in this study 3D meshes are generated by arrangingtwo-dimensional (2D) elliptic grids, at each cross-section (extracted from CT scan), next to each other throughout stenosis models which these 2D elliptic grids generated as follows:
By applying the generalized coordinate, partial differential equations can be solved easily. The relation between the physical and computational domains is assumed to be a satisfied Poisson equation.
![]() (4.1)
(4.1)
Since the numerical solution of equations (4.1) is performed in a rectangular domain with equal spacing, a transformation of equations and associated boundary conditions is required. Interchanging the dependent and independent variable of (4.1), we have:
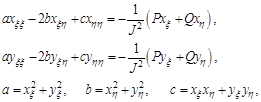 (4.2)
(4.2)
And J is the Jacobean of the transformation:
![]() (4.3)
(4.3)
The terms![]() ,
,![]() ,
, ![]() and
and ![]() are computed initially, from which the Jacobin can be evaluated. The system of elliptic equations (4.2) is solved in the computational domain (
are computed initially, from which the Jacobin can be evaluated. The system of elliptic equations (4.2) is solved in the computational domain (![]() ) in order to provide the grid point locations in the physical space (
) in order to provide the grid point locations in the physical space (![]() ). It is noted that the equations are nonlinear; thus, a linearization procedure must be employed. For simplicity, lagging of the coefficients will be used. i.e. , the coefficients a, b and c are evaluated at the previous iteration [18].
). It is noted that the equations are nonlinear; thus, a linearization procedure must be employed. For simplicity, lagging of the coefficients will be used. i.e. , the coefficients a, b and c are evaluated at the previous iteration [18].
Here P and Q are the control functions affecting the density of the meshes.
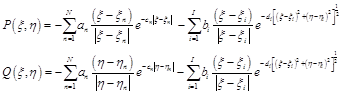 (4.4)
(4.4)
Where an and bi are amplifications factors and cn and di are decay factors. N is number of constant grid lines ![]() and/or
and/or ![]() around which clustering is enforced. Similarly, I is number of grid points around which clustering is enforced [18].
around which clustering is enforced. Similarly, I is number of grid points around which clustering is enforced [18].
As it can be seen from Fig.3, asymmetric model consist of three parts: inlet, constriction and outlet, which inlet and outlet are semi-cylinder and constriction region consist of several irregular cross-sections. For generating computational, clustered and 3D grid in asymmetric model, there are two steps. First, grid generation at inlet and outlet of stenosis, which are similar to a cylinder with Constant cross-section profile, is performed. Thus, 3D grid is generated by meshing first and last cross-sections and interpolating new sections between them. Secondly, at stenosis region, elliptic grid is generated at the each of 2D cross-sections separately by using above method (equation (4.1)) (Fig.3 (a)). The resulting mesh is shown in Fig.3 (b). Furthermore, grid density in the axial and radial direction is varied. It is increased in radial direction toward the walls (by controlling parameters P and Q in each cross-section) and in axial direction at constriction region (by interpolating new sections between each two scanned cross-sections) to handle the critical flow conditions involved in the problem.
Fig.4 shows 3D grids in ideal symmetric model. Generating 3D grids at symmetric model is almost in the same manner explained for asymmetric model in inlet or outlet.
Although this procedure obtained good results, the method appears to have some problems. First, in some geometry and for certain boundary point distributions, implementing the orthogonality in the domain may cause the collapse of several grid lines into one. Second, because of cross-sections with complex boundary, particularly in those with strong curvatures, satisfaction of the convergence criterion in elliptic grid generation causes serious distortion or overlapping of mesh lines and an acceptable solution may not be possible. Therefore, for obtaining three-dimensional, clustered and smooth grids, grids regularity should be verified. The verification is performed by some controlling parameter like Skewness value [19] and maximum grid aspect ratio (MAR)[20].
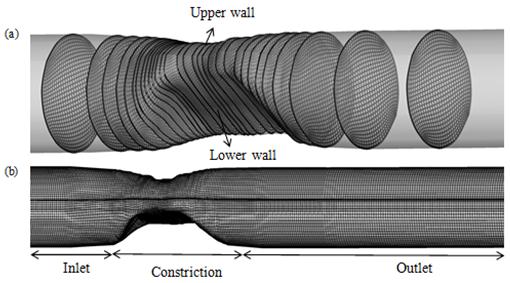
Fig. 3. Elliptic grid generation (a) 2D grids in different cross-sections (b) 3D grids in asymmetric model.
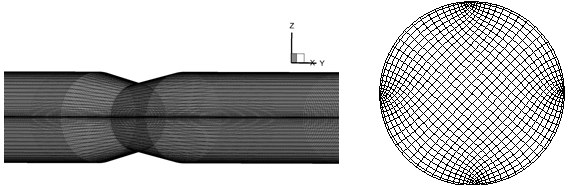
Fig. 4. 3D grids in ideal symmetric model.
Bounding all the aspect ratios is essential for preventing grid lines from collapsing onto each other and high-quality numerical approximations. Therefore, maximum grid aspect ratio are calculated for all computational cells in three models and maximum and mean values of them are given in Table 1.
Table 1. Calculating MAR of computational cells in different models.
| simulation models | maximum MAR in domain | mean MAR in domain |
| Cylinder | 25 | 1 |
| asymmetric stenosis | 25 | 1 |
| symmetric stenosis | 25 | 1 |
In this study, the orthogonalization will finally invert the grid after a sufficient number of repetitions. Grid verification is performed by calculating a normalized cell volume, Skewness value, for each of the cells affected by the orthogonalization. Table 2 presents maximum, minimum and mean values of Skewness for computational cells in all models. A right-angled cell has the Skewness value of one. For a degenerate cell, the Skewness value is zero. As the cells having more right-angled, their Skewness value becomes smaller.
Table 2. Calculating Skewness of computational cells.
| simulation models | maximum Skewness in domain | minimum Skewness in domain | mean Skewness in domain |
| cylinder | 0.9966 | 0.4989 | 0.9 |
| asymmetric stenosis | 0.9770 | 0.2393 | 0.7 |
| symmetric stenosis | 0.9874 | 0.3245 | 0.8 |
Generally following algorithm is carried out for grid generation with high quality at all models simulated in this study:
1. The elliptic Iterative solver which applied for each cross-section is as follows:
A. Identify the boundaries of the domain and use an algebraic method (here, TFI [21]) to obtain an initial mesh.
B. Equation (4.1) is solved in an iterative elliptic loop and the clustering function P and Q are Calculated from Equation (4.4).
C. boundary conditions are adjusted. boundary nodes are Relocated to satisfy orthogonality [21] at the end of each iteration step.
2. 2D elliptic grids are arranged, at each cross-section, next to each other throughout stenosis models.
3. Quality of 3D grids is verified by grid controlling parameters, Skewness and MAR.
4. Grid density is increased by interpolating new sections and correction of clustering function, at poor Skewness and aspect ratio areas.
5. Validation
To make sure the numerical results are reliable, verification and validation of the numerical method and its implementation are further carried out by two approaches. First, the in-house developed code implementing the method is used to simulate a laminar flow through a three dimensional cylindrical channel and Secondly, real asymmetric stenosis model is simulated. Finally, comparisons of our simulation results on the both models with existing results (analytical and experimental, respectively) are made to show the correctness of the method and code. In addition, in order to examining the error associated with grid sizes, grid independence study is performed for all models applied in this study.
5.1. Cylindrical Tube
3D cylindrical channel with nonlinear boundaries could be an appropriate example for this study. Fig.5 shows typical grid independence study which conducted for x-velocity profiles at Re=100. Around 223080 mesh points are the optimal number to obtain grid independent solution.
Fig. 6 exhibits the comparison of mean wall shear stress coefficient [22] between numerical and analytical solution. It can be seen from the figure that the WSS coefficient computed on the coarser grid agrees very well with analytical solution.
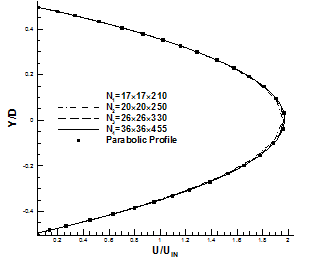
Fig. 5. Comparison of x-velocity profiles using four different grids at fully developed region about outlet of 3D tube.
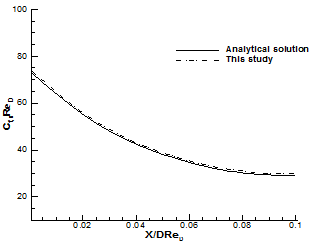
Fig. 6. Comparison of computed mean wall shear stress coefficient at different dimensionless axial locations with the analytical solution [22] at Re=100.
5.2. Stenosis Models
It is important to check the mesh resolutions to be used in the simulation for Stenosis models are adequate enough to resolve the flow downstream of the stenosis. To this end, a grid independence test is conducted for the Newtonian model with three different grids arrangements for both symmetric and asymmetric models. Fig. 7 shows that less than 2 percent difference in x-velocity profile is measured between grids N2 and N3. Therefore, N3 is used in the simulation for both models.
It should be note that the throat of the stenosis is not clearly defined. So, what is really important is how much pressure drop can be getting across the stenosis. Then, the present experimental results involving the pressure drop in case of irregular stenosis for different Reynolds number from 130 to 540.
Comparison between computed and experimental pressure drop at different Reynolds number is presented in Table 3 which exhibit good verification of the numerical method.
Table 3. Calculating the percent error between numerical and experimental pressure drop through stenosis model.
| Re | Numerical pressure drop (Pa) | Experimental pressure drop (Pa) | Error |
| 130 | 47.7 | 52 | 8.26% |
| 160 | 59.31 | 64.77 | 8.42% |
| 190 | 72.74 | 79.92 | 8.9% |
| 540 | 383.65 | 400 | 4.08% |
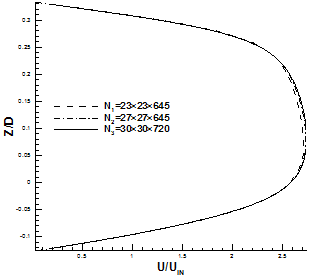
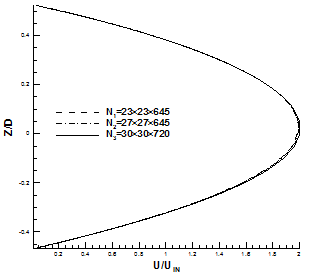
Fig. 7. Comparison of x-velocity profile using three different grids. (a) Throat of asymmetric model. (b) X = 400 mm, fully developed region for symmetric model.
6. Results and Discussion
In this study, an in-house code in Fortran 90 is developed to generate 3D elliptic grids and implement finite volume method in generalized body fitted coordinate at complex geometries. The discretized forms of the transformed equations are obtained by a control volume formulation in a non-staggered grid. The convection terms are treated by power-law scheme and central differencing is applied for diffusion terms. The resulting equations are solved using the SIMPLE algorithm. Moreover, Rhie-Chow momentum-interpolation technique is used to satisfy the continuity and using the non-staggered grid [23]. In addition, in all computations, the convergence criteria were set such that the residual is less than 10-7 for each of velocity and pressure. Finally, the simulation results are presented on four different Reynolds numbers of 130, 160,190 and 540 and a number of interesting observations can be made from them. Moreover, to clearly illustrate the effects of real stenosis on hemodynamic parameters, a symmetric stenosis with same geometrical characteristics are simulated and their results are compared.
Wall shear stress is the tangential drag force produced by blood moving across the endothelial surface. It is a function of the velocity gradient of blood near the endothelial surface. Thus, a small change in the velocity gradient will have a large effect on wall shear stress. It is worthwhile pointing out that strong curvatures, irregularity and constriction at the neck of stenosis lead to sharply increase and intensive oscillation of WSS and these oscillatory forces on the wall of stenosis model exert harmful effects on the endothelial surface. It can be note that the possibility of the endothelium destruction is higher in the regions where wall shear stresses are beyond the range of 10-420 dyne/cm2 which is the safe bandwidth of WSS Consequently, as can develop in these regions[24]. Notably, no attempt appears to have been made in any of the above studies to investigate the oscillatory and high WSS in case of 3D irregular stenosis. While, these results have special features and show the high and oscillatory wall shear stress at irregular stenosis. Furthermore, the results involving the swirl flow, velocity distribution, length of separation zones which are other important factors in development of arterial disease.
Fig. 8 demonstrates the comparison between the local WSS at the upper and lower wall (Fig.3 (a)) throughout asymmetric model for the Reynolds numbers 130, 160,190, and 540. As it can be seen distributions of local WSS are almost different on the lower and upper wall at stenosis area due to the asymmetric cross-sections at this region. The fluctuation of WSS on the lower wall is stronger than that on the upper wall which is clearly obvious in this Figure. It is seen that the location of the positive peak WSS occurs at the neck of stenosis on the lower wall just before the upper wall in all Reynolds number and In case of lower wall, the magnitude of positive peak WSS is smaller to those in upper wall. In addition, WSS reaches the negative peak value at the post lip of stenosis on both upper and lower wall for all Reynolds number which corresponds to the counter rotating vortices in these zones. It is worthwhile pointing out that after this peak at downstream of stenosis a negative WSS area is found on the lower wall due to recirculation region which is not exist on the upper wall. Since tangential drag forces exerted on the lower wall at stenosis are much higher than those at the upper wall, it can be concluded that the probability of arterial disease at lower wall of constriction is much higher than that on upper wall. In order to provide insight into these tangential drag forces on the lower wall at constriction, contour plots of WSS at this area are shown in Fig. 9 which compares these values at lower wall of the asymmetric stenosis for maximum and minimum Reynolds number. The regions indicated by black circle (dark blue color) just upstream and downstream of stenosis are low WSS (lower than the critical point of 10 dyne/cm2) areas which may relate to the recirculation regions exist due to the adverse pressure gradient. As it can be seen from Figure, these low WSS regions are spread with the increasing Reynolds number. High WSS region are clearly exhibited at the neck of stenosis no matter what the value of Reynolds number is. While, for the case with Reynolds number=540, the stenosis has a stronger effect on the WSS than the result of Reynolds number=130 and reach to critical value in some points (it is indicated by red color). It is worthwhile pointing out that Oscillation of WSS which can be seen in stenosis region at Re=540 might be important factors in atherogenesis (formation of abnormal fatty or lipid masses in arterial walls) and progression of atherosclerosis.
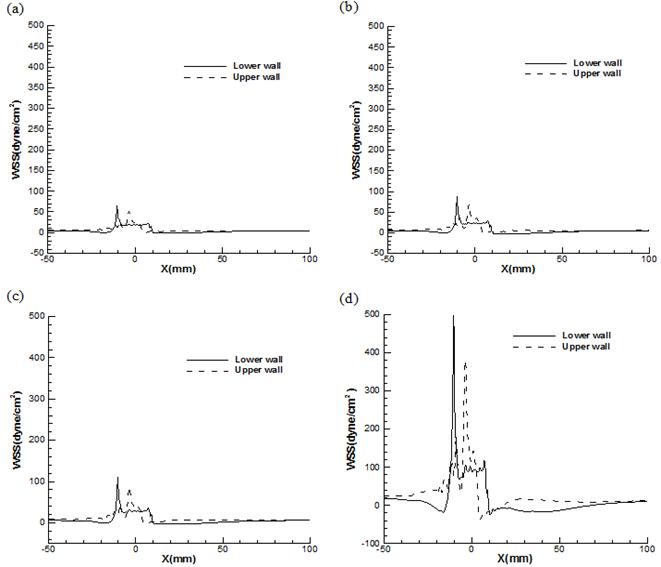
Fig. 8. Comparison of local WSS at lower wall and upper wall of asymmetric stenosis for (a) Re=130 (b) Re=160 (c) Re=190 (d) Re=540.
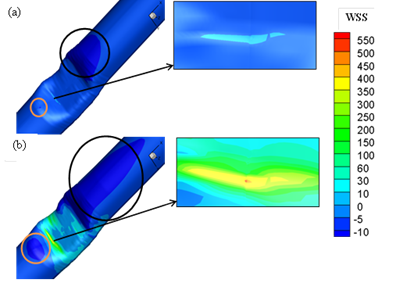
Fig. 9. Contour plots of WSS at the upper wall of the asymmetric stenosis at (a) Re=130 (b) Re=540.
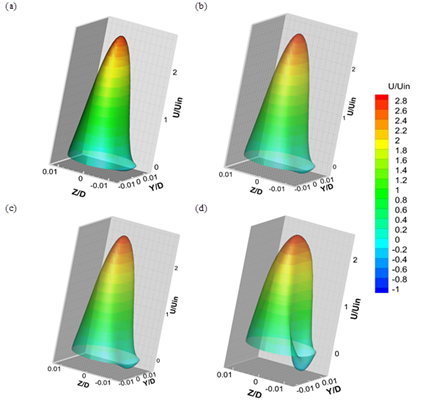
Fig. 10. 3D contour plots of stream wise velocity in the cross-section at downstream of stenosis for (a) Re=130 (b) Re=160(c) Re=190(d) Re=540.
Fig 10 shows 3D contour plots of stream wise velocity at a cross-section in the downstream of stenosis for different Reynolds number. The plot shows a large mean recirculation zone behind the stenosis on the lower wall, which extends about 2.27D downstream of the stenosis by increasing Reynolds number up to 540. At this recirculation region indicated clearly by the negative velocity (blue colour), blood moves in the direction opposite to the mean flow. These closed recirculation zones, with low shearing stresses, spread due to the increase of flow rate at high Reynolds number which causes an increase in particle residence time, so that lipoproteins and monocytes (the anlagen of atherosclerosis) have greater contact with the endothelium in these regions.
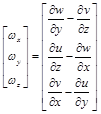
Another important blood flow phenomena formed in stenotic artery is swirling motion at downstream of the stenosis which relate to the asymmetric behaviour of flow due to passing across irregular constriction[7]. It is believed that swirl flow may lead to relative uniformity of WSS and inhibition of flow stagnation, separation and instability [25]. Fig. 11 shows 3D iso-surface plot of swirl flow downstream of stenosis. It can be seen that swirl flow extends to the stream wise direction by increasing the Reynolds number.
In this approach swirl is calculated as:
 (6.1)
(6.1)
Where![]() , is the velocity vector in Cartesian coordinate and
, is the velocity vector in Cartesian coordinate and![]() is the vorticity vector.
is the vorticity vector.
![]() (6.2)
(6.2)
And its components are evaluated by:
 (6.3)
(6.3)
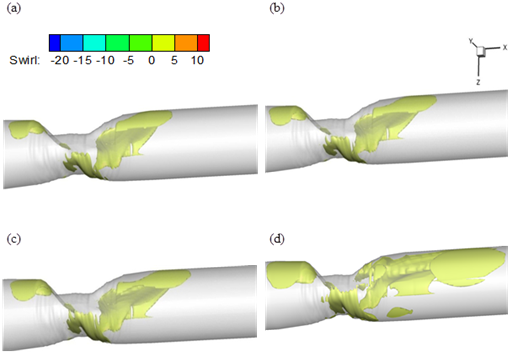
Fig. 11. Iso-surface plot of swirl flow (a) Re=130 (b) Re=160 (c) Re=190 (d) Re=540.
The comparisons in Figs.12-15 are carried out on the both symmetric and asymmetric stenosis model to demonstrate the considerable differences between results of real and idealized stenosis.
It is noted that, the flow rates are directly proportional to WSS and a small change in the velocity gradient due to the increase of flow rate will have a large effect on WSS. The profile of the non-dimensional maximum axial velocity is shown in Fig. 12 for both stenosis models at different Reynolds number. It is clear that the magnitude of the maximum velocity values increase rapidly when the flow approaches to the constriction and reaching a peak value at the neck of stenosis and then decreases gradually to downstream of stenosis no matter what the value of Reynolds number is. It is noted that this peak value in asymmetric model is much bigger than symmetric one and this difference is increased with the increasing Reynolds number. It can be also observed that a local minimum (black circle) occurs at the neck of stenosis in case of asymmetric model due to the special shape of constriction which does not exist at symmetric model. This local minimum area can also causes some oscillation in WSS because of changing velocity gradient near the wall of artery.
Fig. 13 shows the distribution of WSS on the both symmetric and asymmetric stenosis model for different Reynolds number. It is shown that the location of maximum WSS is always at the neck of stenosis due to the maximum flow rates and independent of Reynolds number. It is demonstrated that the amplitude of the wall stress oscillation at the stenosis zone for asymmetric artery is larger than that in the corresponding symmetrical model. Fig. 14 shows this oscillation in both models separately in the case of Reynolds number 540 to illustrate the variation of fluctuation in WSS profiles for two models more clearly.
Fig. 12. Comparison of non-dimensional maximum stream wise velocity (a) Re=130 (b) Re=160 (c) Re=190 (d) Re=540.
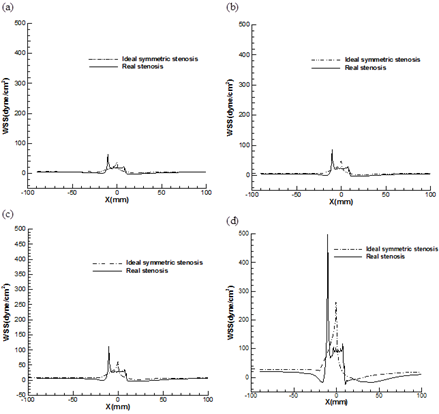
Fig. 13. Comparison of local WSS at normal and real stenosis for (a) Re=130 (b) Re=160 (c) Re=190 (d) Re=540.
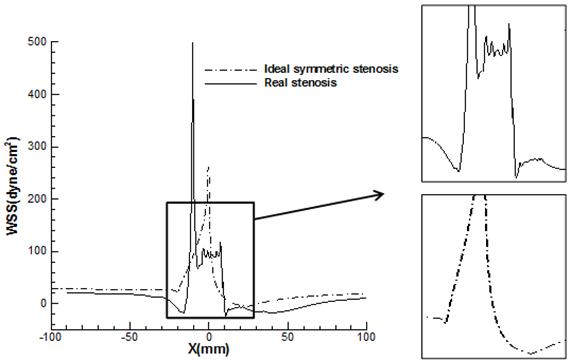
Fig. 14. Comparison of oscillation of local WSS at stenosis region for real and normal stenosis (Re=540).
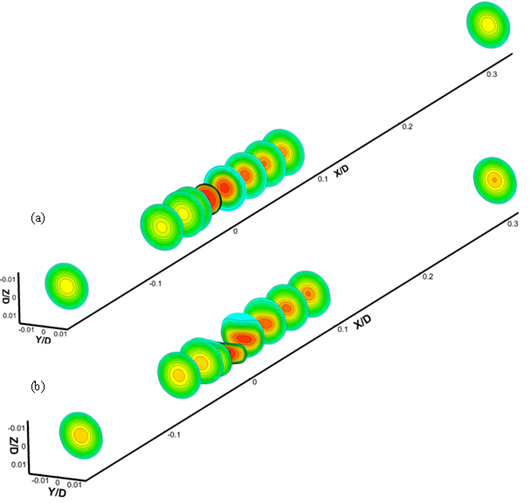
Fig. 15. Shows contour plots of axial velocity at x =inlet, -2D, -0.5D, 0, 0.5D, 1D, 2D, 3D, 4D and outlet for (a) asymmetric model (b) ideal symmetric model.
It is noteworthy that the largest positive-negative oscillation occurs within the stenosis region of the asymmetric model at Reynolds number 540 (500_-24 dyne/cm2). These values relate to the irregular cross-sections at the neck of constriction (WSS =500 dyne/cm2) and the reattachment locations of the second separation zone behind the stenosis on the lower wall (WSS =-24 dyne/cm2).
The magnitudes of positive and negative peak WSS in both models are presented in Table 4. It is concluded that the peak WSS magnitude (at the constriction) is increased rapidly as the Reynolds number increases and maximum and minimum WSS are attained in case of an asymmetric stenosis. The positive and negative peak of WSS at asymmetric stenosis are two and five times bigger than those in symmetric model, respectively which these tremendously differences can’t be negligible. It is also noted that the maximum value of WSS at Reynolds number 540 for asymmetric model (500 dyne/cm2), with considering the Safe bandwidth of WSS is another key and dangerous characteristic of vulnerable plaques which can’t be seen at symmetric stenosis model.
Table 4. The amount of positive and negative peak WSS (dyne/cm2) for asymmetric and symmetric stenosis models.
| Re | Asymmetric stenosis | Symmetric stenosis | |||
| Positive peak | Negative peak | Positive peak | Negative peak | ||
| 130 | 61.8 | -1.16 | 36 | -1.1 | |
| 160 | 87 | -2.4 | 47.7 | -1.3 | |
| 190 | 111.45 | -3.5 | 60 | -2.6 | |
| 540 | 500 | -24 | 251 | -5 | |
Flow separation might occur in the arterial system at sites of curvature, branching or expansion of the cross-section. Suggested links between flow separation and the development of atherosclerosis included mechanical damage to the wall[26; 27], platelet deposition [28], and fibrin deposition[29]. Flow separation and static zones may occur in arteries and investigation of the issue continues[30].
Table 5 demonstrates the length of separation regions (LSP), the distance between the two points of separation and reattachment, at upstream and downstream of stenosis for symmetric and asymmetric models. These data clearly exhibit the variation of separation zones at constriction zone in four Reynolds numbers 130,160,190 and 540. As it can be seen symmetric flow behavior of normal stenosis causes small separation zones upstream of stenosis in case of Reynolds number 540 and no separation takes place at other Reynolds number. In addition, according to table 5 there are some separation regions with various lengths can be seen in case of asymmetric model which growth with the increasing Reynolds number and maximum value occurs at post-lip of stenosis on the lower wall which is 19 times longer than that in symmetric stenosis at same place. Consequently, it is worthwhile pointing out that asymmetry stenosis plays an important role in flow separation. This is of clinical importance because cell residence time and plaque growth is related to the recirculation region [31].
Table 5. The length of separation regions at upstream and downstream of stenosis in symmetric and asymmetric models.
| Re | Asymmetric stenosis | Symmetric stenosis | ||||||
| Lsp (upstream) | Lsp (downstream) | Lsp (upstream) | Lsp (downstream) | |||||
| Lower wall | Upper wall | Lower wall | Upper wall | Lower wall | Upper wall | Lower wall | Upper wall | |
| 130 | - | - | 0.96 D | - | - | - | - | - |
| 160 | - | - | 1.14 D | - | - | - | - | - |
| 190 | 0.16 D | - | 1.3 D | 0.12 D | - | - | - | - |
| 540 | 0.32 D | - | 2.27 D | 0.58 D | - | - | 0.03 D | 0.03 D |
Fig. 15 depicts axial velocity contours over different cross-sections throughout both symmetric and asymmetric models. It is shown that, in the case of real stenosis, the breaking of the flow axisymmetry is associated with changes in the circumferential direction at cross-sections within the constriction (Fig. 15 (b)). However, the symmetric flow behaviour persists throughout the symmetric model at same cross-sections. In addition, flow recirculation regions formed near the walls of stenosis at different cross-sections, due to the large curvature of the bends, which presented at table 5 can be seen clearly at this Fig (blue colour regions).
7. Conclusions
The numerical simulation of the Newtonian blood flow characterized through arterial constrictions is primarily based on finite volume based finite difference method and the geometry of asymmetric stenosed artery is extracted from CT scan images. All the governing equations in fluid flow and grid generation are carried out in general curvilinear coordinates. The numerical stability and the necessary convergence of the results obtained have been thoroughly examined and achieved with satisfactory level of accuracy. The simulation concerning grid independence study is performed for the purpose of verification of the present numerical code and examining the error associated with grid sizes used. It is found that the results for three distinct grid sizes (23×23×645, 27×27×645, 30×30×720) almost overlap with each other. Hence, the solutions are computed through the generation of elliptic grid with a size of 470205 in the entire domain of computation. Generally, it is concluded as follows:
1. Flow characteristics such as maximum stream wise velocity, swirl flow and wall shear stress, are highly dependent on the flow Reynolds number, and they are enhanced by the increase of the Reynolds number.
2. One of the most achievements of this study is observation of high and Oscillatory WSS in case of asymmetric mode which at high Reynolds number become worse and the serious damage to the vessel wall may occur. It is noted that these flow phenomena are observed with considering blood flow steady and laminar.
3. It is showed that formation and development of flow separation zones (FSZs) in the post-stenosis region are very complex. It is highlighted the fact that the high level of the FSZs due to the maximum Reynolds number which found in the downstream of the stenosis could activate the blood platelets and also damage the blood cell materials, and consequently they could create many pathological diseases.
References
- F. Smith, The separating flow through a severely constricted symmetric tube. Journal of Fluid Mechanics 90 (1979) 725-754.
- M. Deshpande, D. Giddens, and R. Mabon, Steady laminar flow through modelled vascular stenoses. Journal of Biomechanics 9 (1976) 165-174.
- D.F. Young, and F.Y. Tsai, Flow characteristics in models of arterial stenoses—I. Steady flow. Journal of Biomechanics 6 (1973) 395-410.
- D.N. Ku, Blood flow in arteries. Annual Review of Fluid Mechanics 29 (1997) 399-434.
- Y. Tardy, N. Resnick, T. Nagel, M. Gimbrone, and C. Dewey, Shear stress gradients remodel endothelial monolayers in vitro via a cell proliferation-migration-loss cycle. Arteriosclerosis, thrombosis, and vascular biology 17 (1997) 3102-3106.
- R. Mittal, S. Simmons, and F. Najjar, Numerical study of pulsatile flow in a constricted channel. Journal of Fluid Mechanics 485 (2003) 337-378.
- H. Jung, J.W. Choi, and C.G. Park, Asymmetric flows of non-Newtonian fluids in symmetric stenosed artery. Korea-Australia Rheology Journal 16 (2004) 101-108.
- F. Abraham, M. Behr, and M. Heinkenschloss, Shape optimization in steady blood flow: a numerical study of non-Newtonian effects. Computer Methods in Biomechanics and Biomedical Engineering 8 (2005) 127-137.
- Y. Zhang, T. Furusawa, S.F. Sia, M. Umezu, and Y. Qian, Proposition of an outflow boundary approach for carotid artery stenosis CFD simulation. Computer Methods in Biomechanics and Biomedical Engineering 16 (2013) 488-494.
- S. Glagov, C. Zarins, D. Giddens, and D. Ku, Hemodynamics and atherosclerosis. Insights and perspectives gained from studies of human arteries. Archives of pathology & laboratory medicine 112 (1988) 1018-1031.
- A.M. Shaaban, and A.J. Duerinckx, Wall shear stress and early atherosclerosis: a review. American Journal of Roentgenology 174 (2000) 1657-1665.
- C.K. Zarins, D.P. Giddens, B. Bharadvaj, V.S. Sottiurai, R.F. Mabon, and S. Glagov, Carotid bifurcation atherosclerosis. Quantitative correlation of plaque localization with flow velocity profiles and wall shear stress. Circulation research 53 (1983) 502-514.
- M.H. Friedman, G.M. Hutchins, C. Brent Bargeron, O.J. Deters, and F.F. Mark, Correlation between intimal thickness and fluid shear in human arteries. Atherosclerosis 39 (1981) 425-436.
- D.N. Ku, D.P. Giddens, C.K. Zarins, and S. Glagov, Pulsatile flow and atherosclerosis in the human carotid bifurcation. Positive correlation between plaque location and low oscillating shear stress. Arteriosclerosis, thrombosis, and vascular biology 5 (1985) 293-302.
- E.M. Pedersen, I. Kristensen, and A. Yoganathan, Wall shear stress and early atherosclerotic lesions in the abdominal aorta in young adults. European journal of vascular and endovascular surgery 13 (1997) 443-451.
- T.J. Pedley, The fluid mechanics of large blood vessels, Cambridge University Press Cambridge, 1980.
- C.A.J. Fletcher, Computational Techniques for Fluid Dynamics 2, Springer, 1991.
- K.A. Hoffmann, and S.T. Chiang, Computational fluid dynamics for engineers, Engineering Education System Wichita, Kansas,, USA, 1993.
- V. Akcelik, B. Jaramaz, and O. Ghattas, Nearly Orthogonal Two-Dimensional Grid Generation with Aspect Ratio Control. Journal of Computational Physics 171 (2001) 805-821.
- R. Lehtimäki, An algebraic boundary orthogonalization procedure for structured grids. International journal for numerical methods in fluids 32 (2000) 605-618.
- M. Farrashkhalvat, and J. Miles, Basic Structured Grid Generation: With an introduction to unstructured grid generation, Butterworth-Heinemann, 2003.
- A. Bejan, Convection heat transfer, John Wiley & Sons, 2013.
- J.H. Ferziger, and M. Perić, Computational methods for fluid dynamics, Springer Berlin, 1996.
- A.T. Golpayeghani, S. Najarian, and M. Movahedi, Numerical simulation of pulsatile flow with newtonian and non-newtonian behavior in arterial stenosis. Iranian Cardiovascular Research Journal 1 (2008) 167-174.
- F. Zhan, Y.-B. Fan, and X.-Y. Deng, Effect of swirling flow on platelet concentration distribution in small-caliber artificial grafts and end-to-end anastomoses. Acta Mechanica Sinica 27 (2011) 833-839.
- W. Gutstein, and D. Schneck, < i> In vitro</i> boundary layer studies of blood flow in branched tubes. Journal of atherosclerosis research 7 (1967) 295-299.
- H. Scharfstein, W.H. Gutstein, and L. Lewis, Changes of boundary layer flow in model systems implications for initiation of endothelial injury. Circulation research 13 (1963) 580-584.
- J. Kirk, Evolution of the Atherosclerotic Plaque. Journal of Gerontology 19 (1964) 522-522.
- J. Fox, and A. Hugh, Localization of atheroma: a theory based on boundary layer separation. British heart journal 28 (1966) 388.
- Y. Papaharilaou, D. Doorly, and S. Sherwin, The influence of out-of-plane geometry on pulsatile flow within a distal end-to-side anastomosis. Journal of Biomechanics 35 (2002) 1225-1239.
- B. Vahidi, and N. Fatouraee, Large deforming buoyant embolus passing through a stenotic common carotid artery: A computational simulation. Journal of Biomechanics 45 (2012) 1312-1322.


